Category Archives: For Buyers

Auto Added by WPeMatico

Closing Costs Unpacked: State-by-State Breakdowns for Today’s Buyers

Closing Costs Unpacked: State-by-State Breakdowns for Today’s Buyers Simplifying The Market

If you’re planning to buy a home this year, there’s one expense you can’t afford to overlook: closing costs.

Almost every buyer knows they exist, but not that many know exactly what they cover, or how different they can be based on where you’re buying. So, let’s break them down.

What Are Closing Costs?

Your closing costs are the additional fees and payments you make when finalizing your home purchase. Every buyer has them. According to Freddie Mac, they typically include things like homeowner insurance and title insurance, as well as various fees for your:

  • Loan application
  • Credit report
  • Loan origination
  • Home appraisal
  • Home inspection
  • Property survey
  • Attorney

National vs. Local: Why the Numbers Look So Different

When you search for information about closing costs online, you’ll often see a national range, usually 2% to 5% of the home’s purchase price. While that’s a useful starting point if you’re working on your homebuying budget, it doesn’t tell the whole story. In reality, your closing costs will also vary based on:

  • Taxes and fees where you live (like transfer taxes and recording fees)
  • Service costs for things like title and attorney work in your local area

While the home price is obviously going to matter, state laws, tax rates, and even the going costs for title and attorney services can change what you expect to pay. That’s why it’s important to talk to the pros ahead of time so you know what to budget for. It can put you in control before you even start shopping.

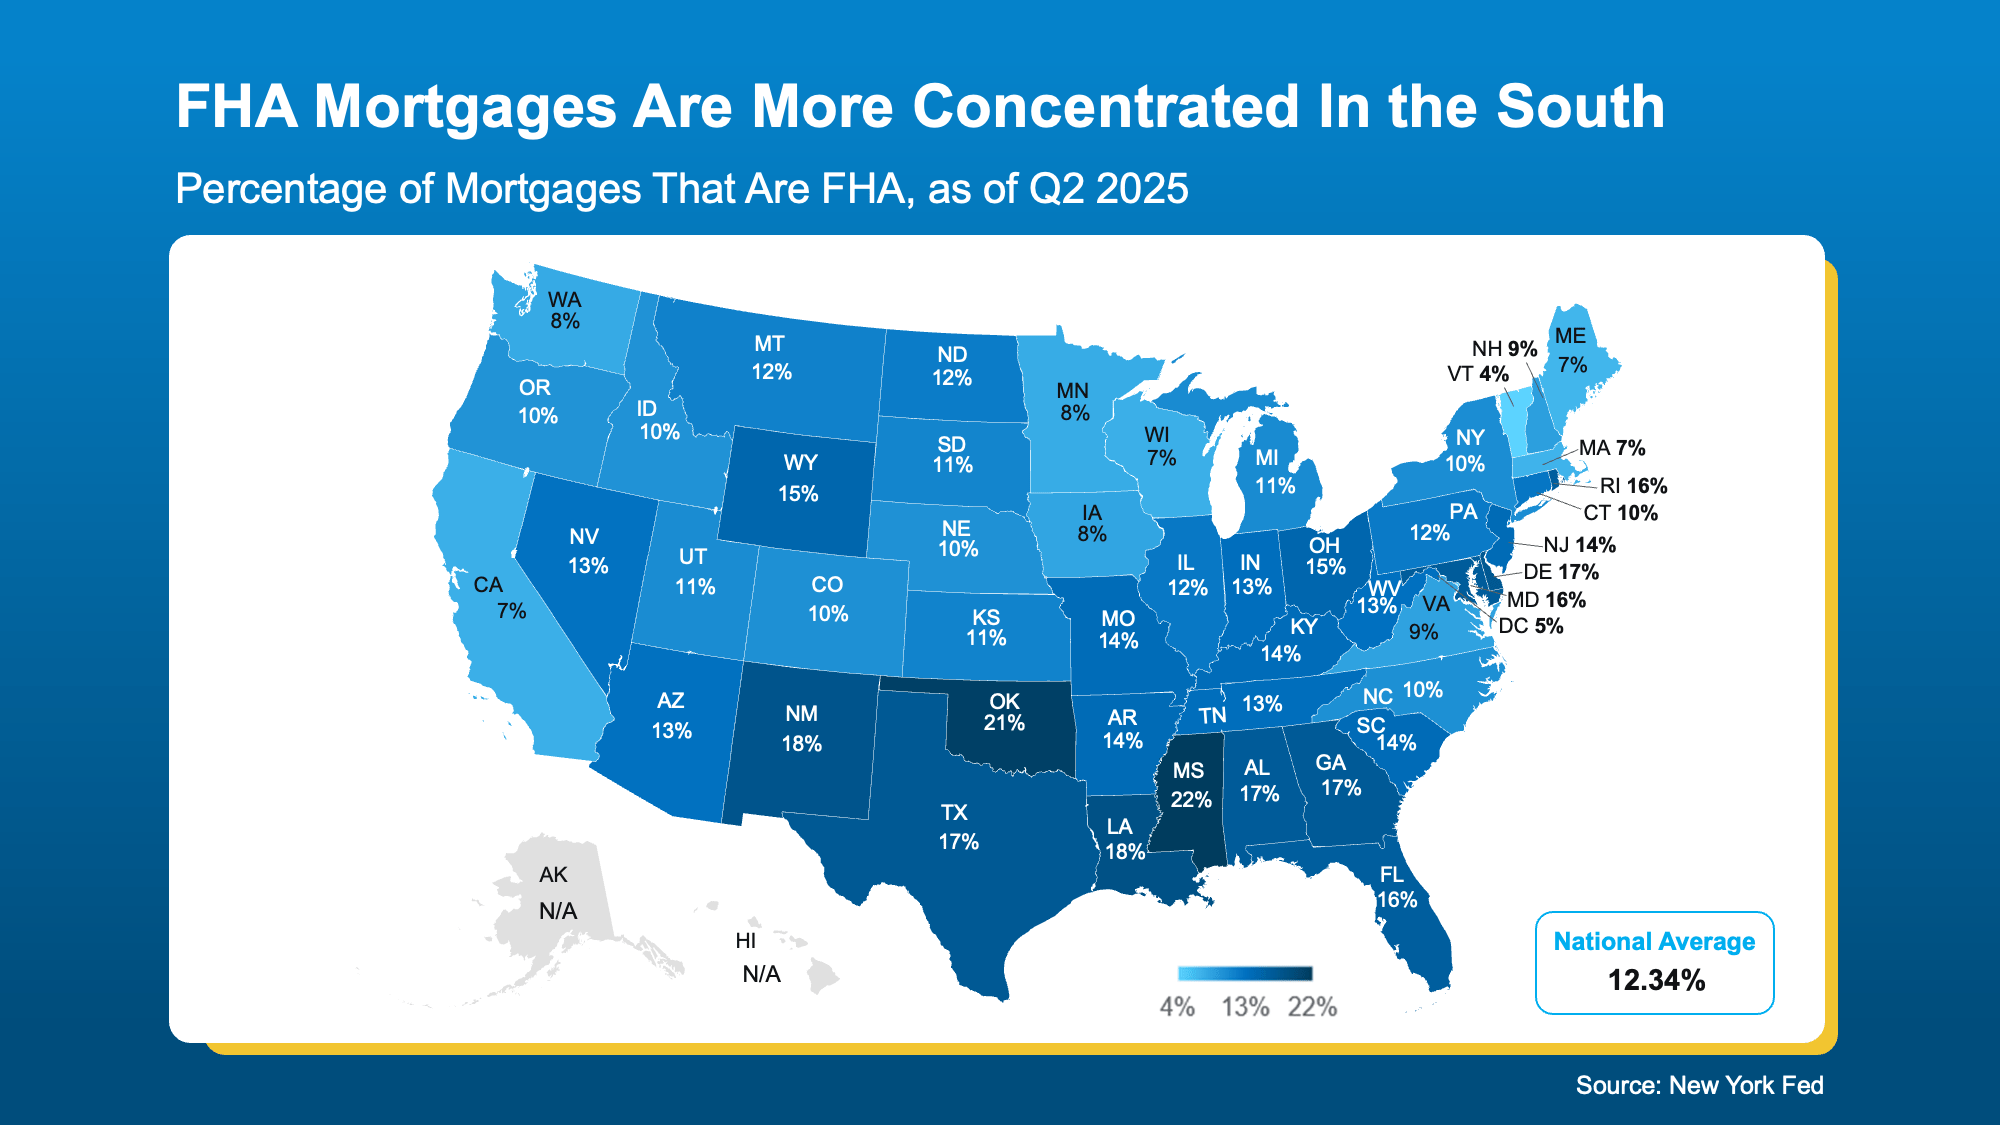
To give you a rough ballpark, here’s a state-by-state look at typical closing costs right now based on those factors for the median-priced home in each state (see map below):

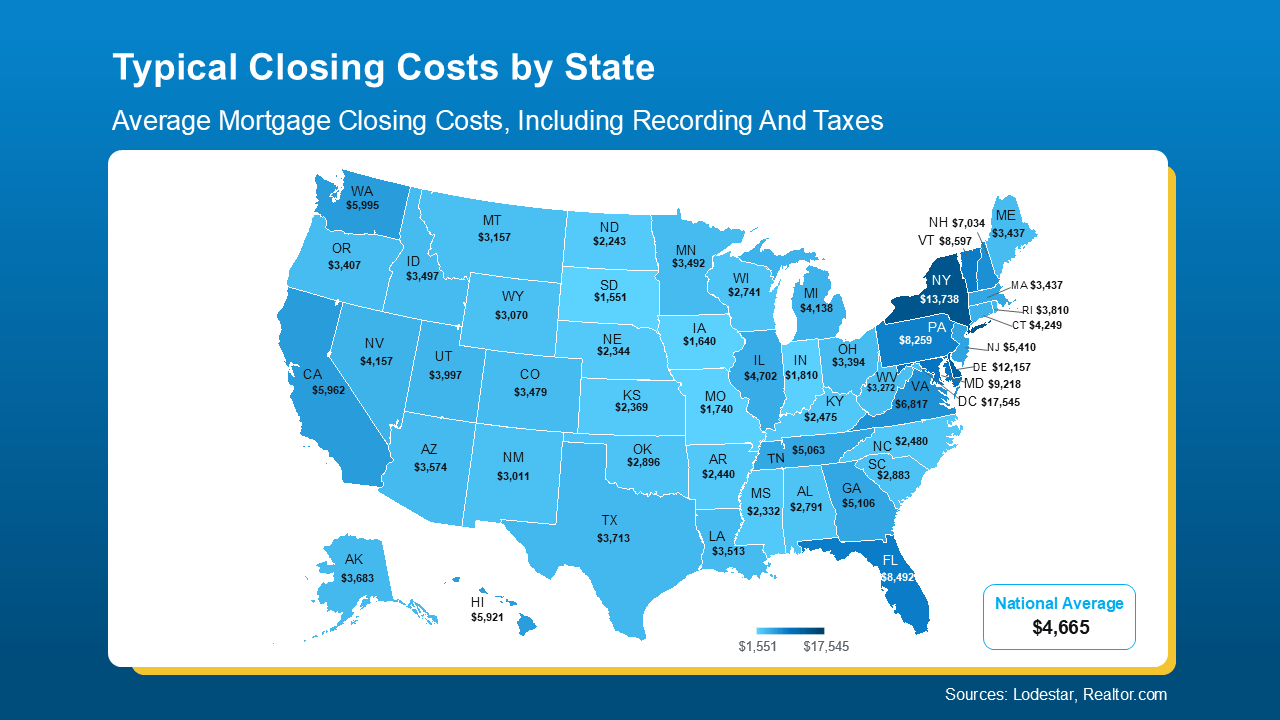
As the map shows, in some states, typical closing costs are just roughly $1-3K. In a few places, they can be closer to $10-15K. That’s a big swing, especially if you’re buying your first home. And that’s why knowing what to expect matters.

If you want a real number to help with your budget, your best bet is to talk to a local agent and a lender. They can run the math for your price range, loan type, and exact location.

And just in case you’re looking at your state’s number and wondering if there’s any way to trim that bill, NerdWallet shares a few strategies that can help:

  • Negotiate with the seller. Ask for concessions like a credit toward your closing costs.
  • Shop around for homeowner’s insurance. Compare coverage and rates before you commit.
  • Check for assistance programs. Some states, professions, and neighborhoods offer help. Your agent and lender can point you to what’s available locally.

Bottom Line

Closing costs are a key part of buying a home, but they can vary more than most people realize. Knowing your numbers (and how to potentially bring them down) can go a long way and help you feel confident about your purchase.

Connect with a local agent or lender to take a look at typical closing costs in your area and get your personalized estimate, so you can craft your ideal budget.


Why Buyers and Sellers Face Very Different Conditions Today

Why Buyers and Sellers Face Very Different Conditions Today Simplifying The Market

There’s a new divide in housing right now. In some states, buyers are gaining ground. In others, sellers still have the upper hand. It all depends on where you live. Curious what’s happening in your state?

These 3 maps show how the split is playing out across the country. In each one:

  • Darker Shades of Blue = Buyer friendly
  • Lighter Shades of Blue = Seller strong

Inventory Sets the Stage

While the number of homes for sale has improved pretty much across the board, how much growth we’ve seen can look dramatically different based on where you live. And that impacts who has the leverage today.

This map uses data from Realtor.com to break it down:

  • The darker shades of blue show where inventory has risen more than in other areas of the country. Buyers here have more to choose from and should have an easier time finding a home and leveraging their negotiating power.
  • The lighter shades of blue are where inventory is still low. Sellers are more likely to sell quickly and make fewer concessions.

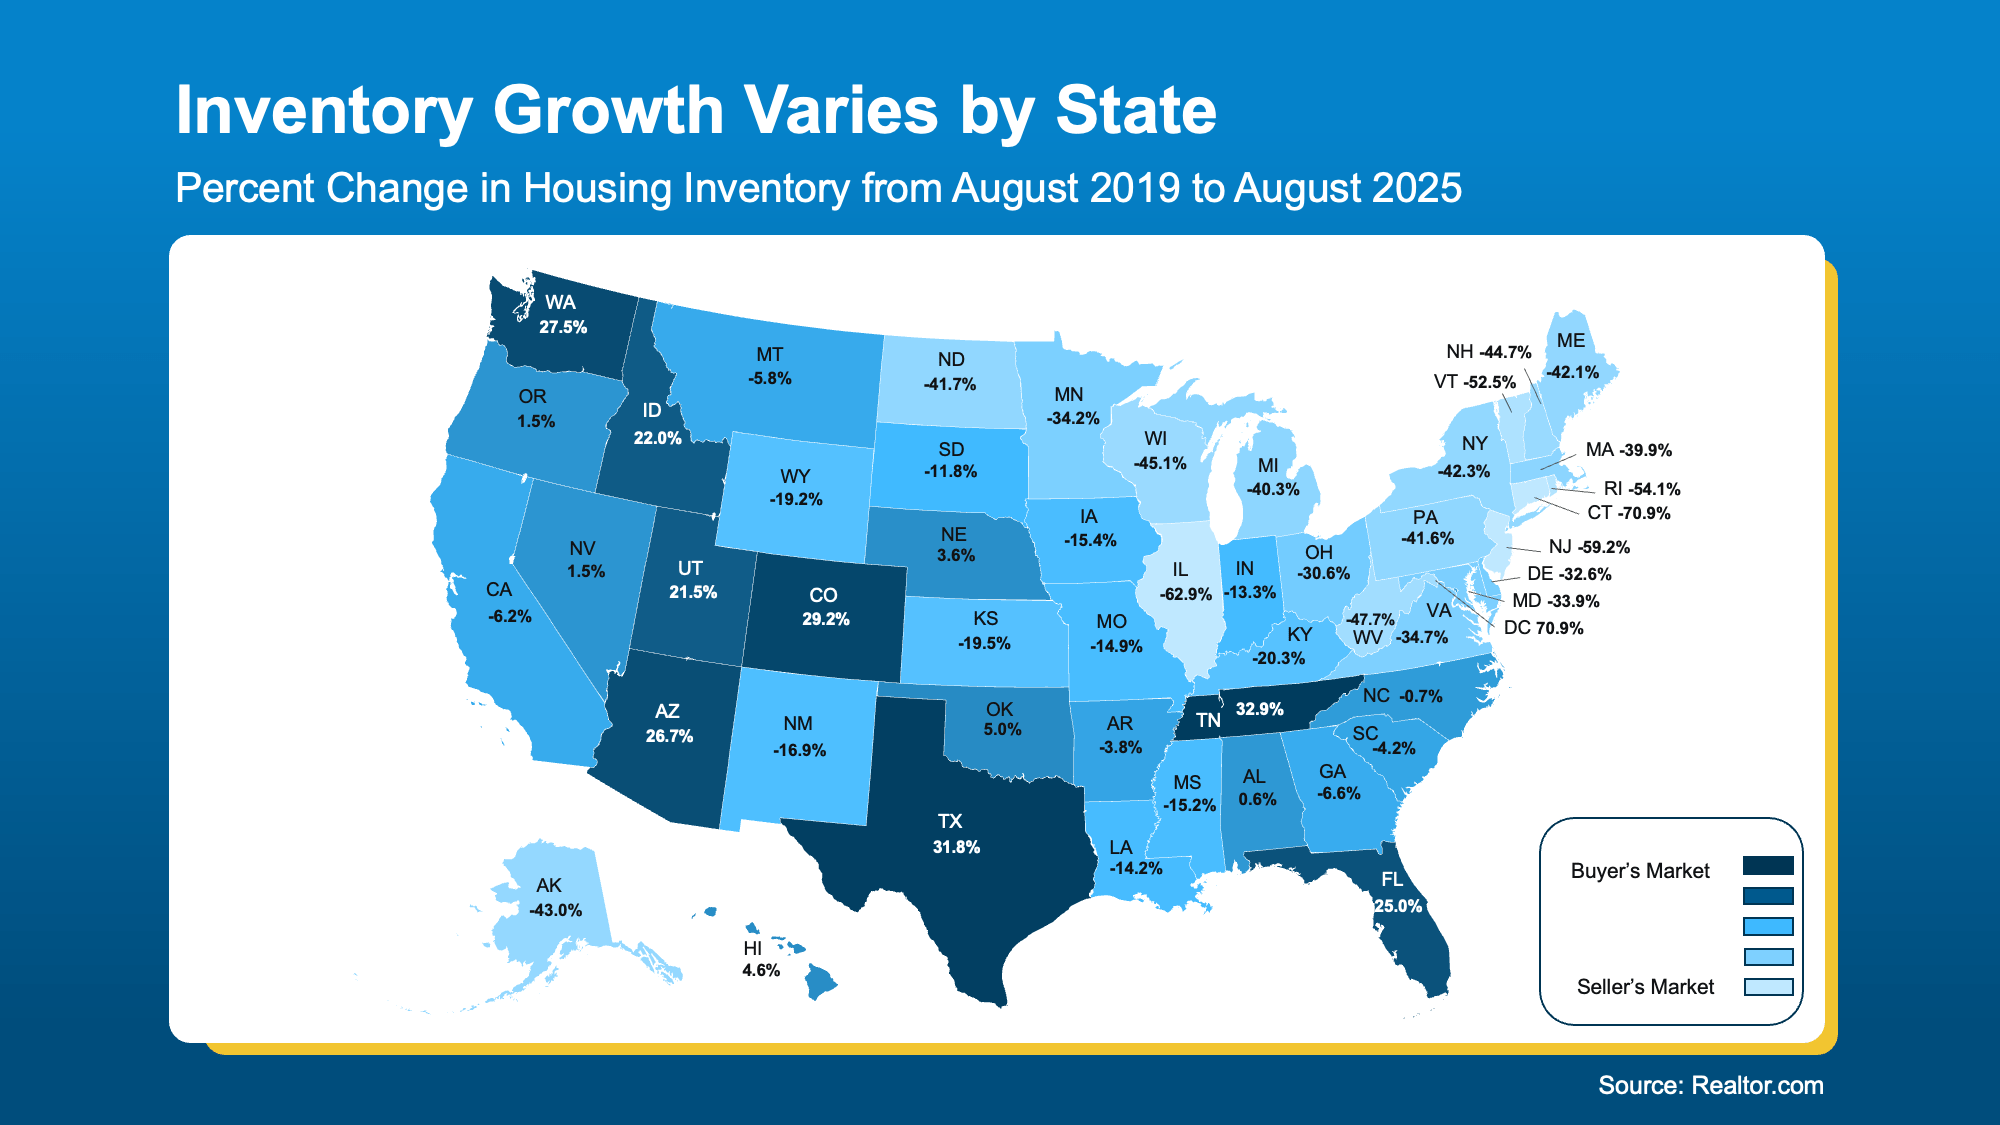
Prices Follow Inventory

The second map tracks how home prices are shifting by state. Just like above, you can see the divide taking shape. Many of the same areas are darker blue. That’s because there’s such a close tie between inventory and prices. When inventory rises, prices moderate.

  • The darker shades of blue are where prices are actually coming down slightly or flattening. Because, with more homes for sale, sellers may have to cut their price or throw in concessions to get a deal done. And that benefits budget-conscious buyers.
  • The lighter shades of blue show areas where prices are still climbing because inventory is low. Sellers may still see buyers competing for homes, and that pushes prices higher.

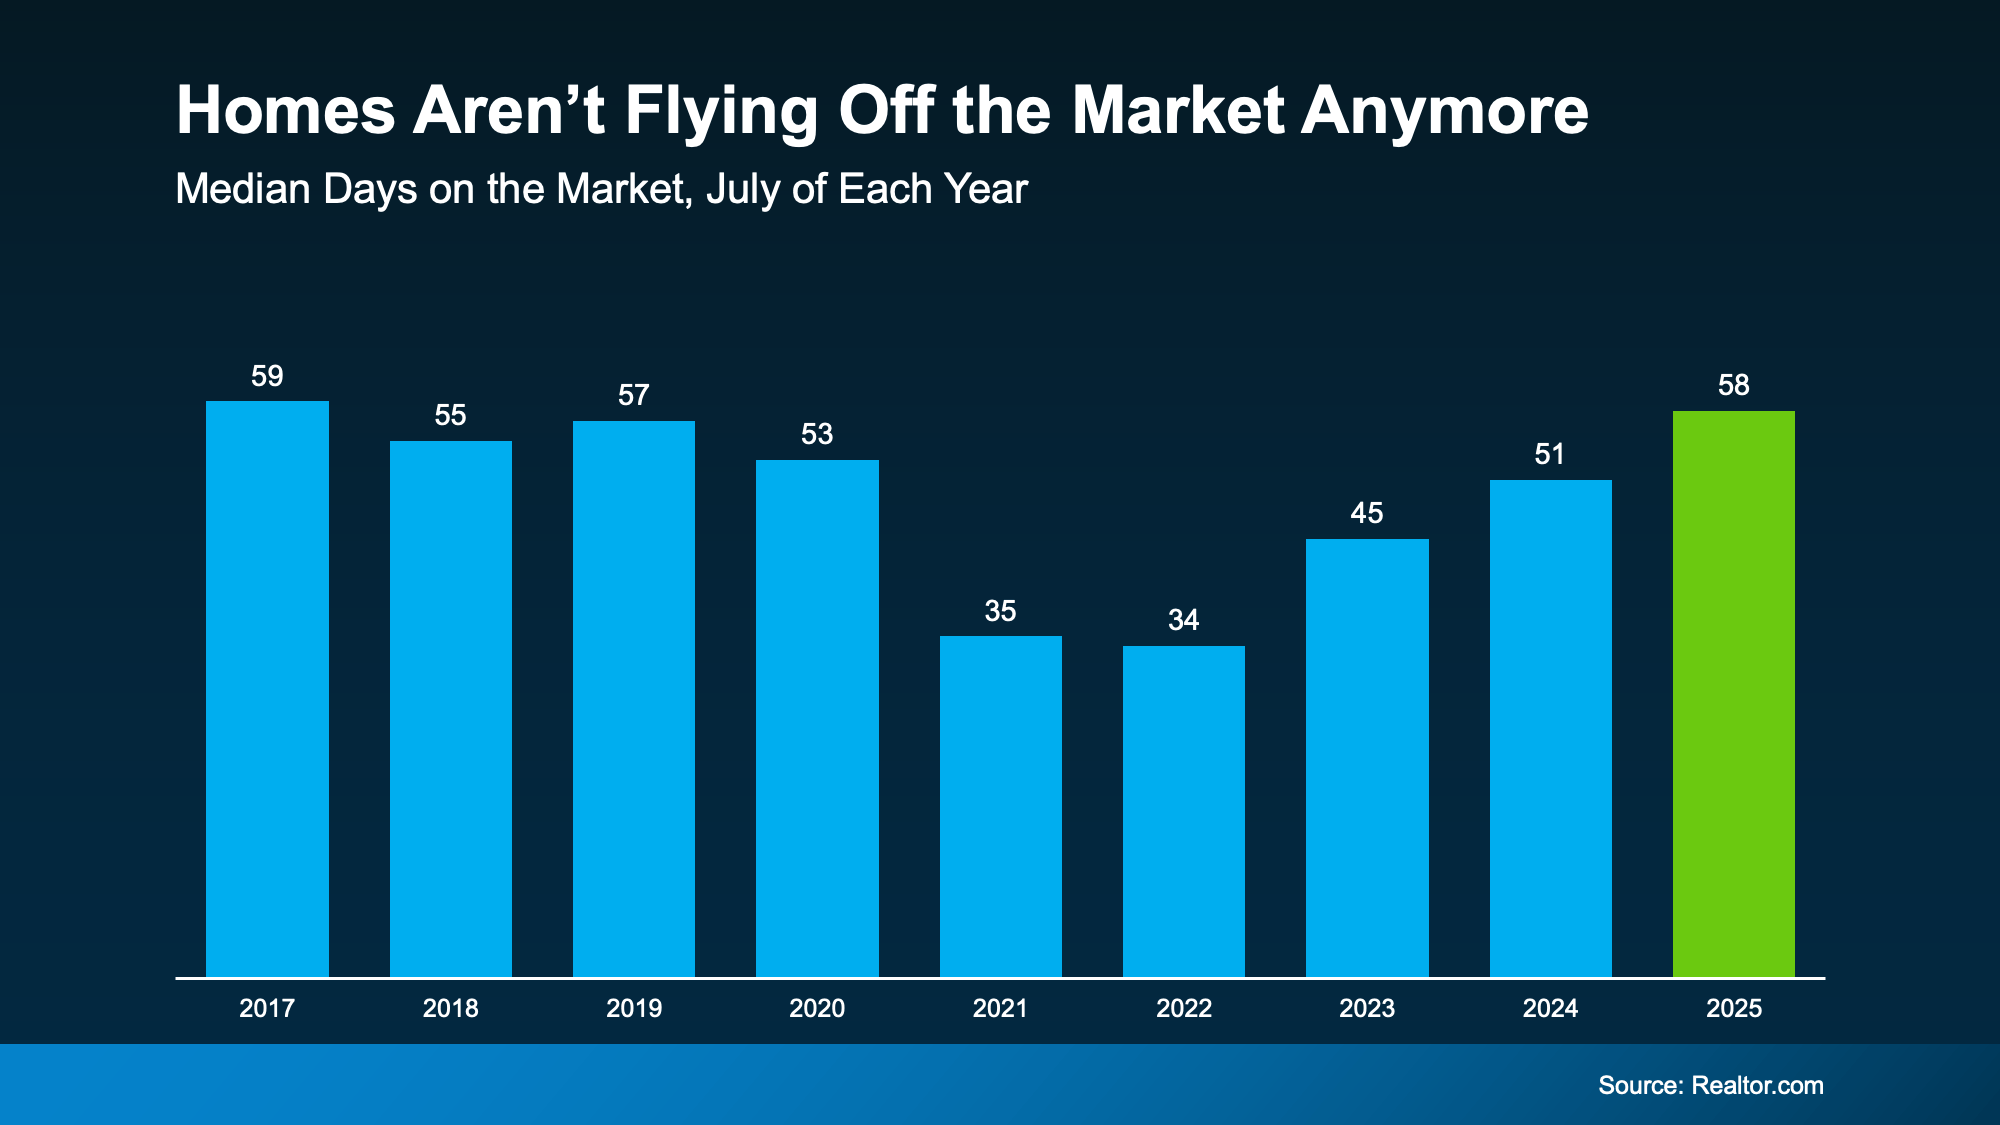
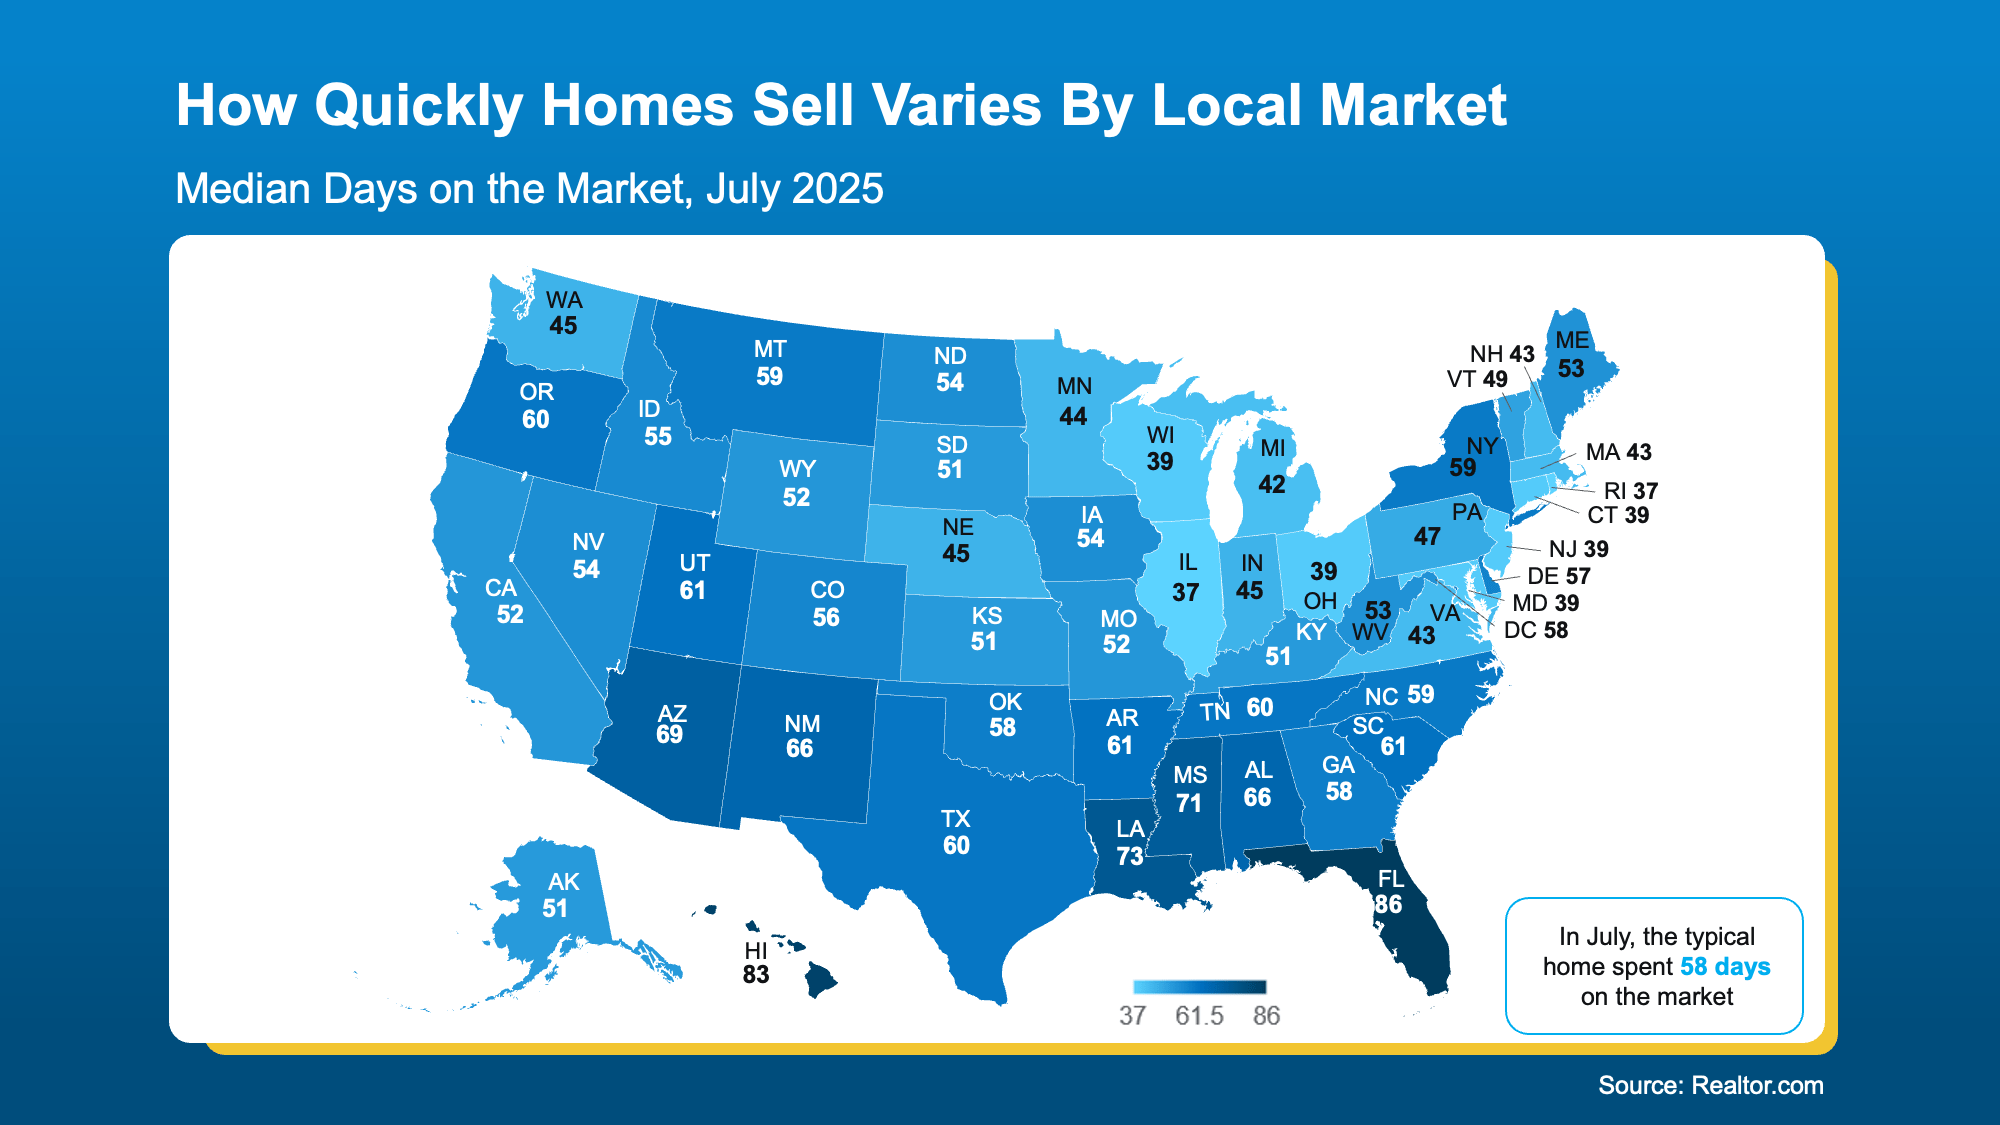
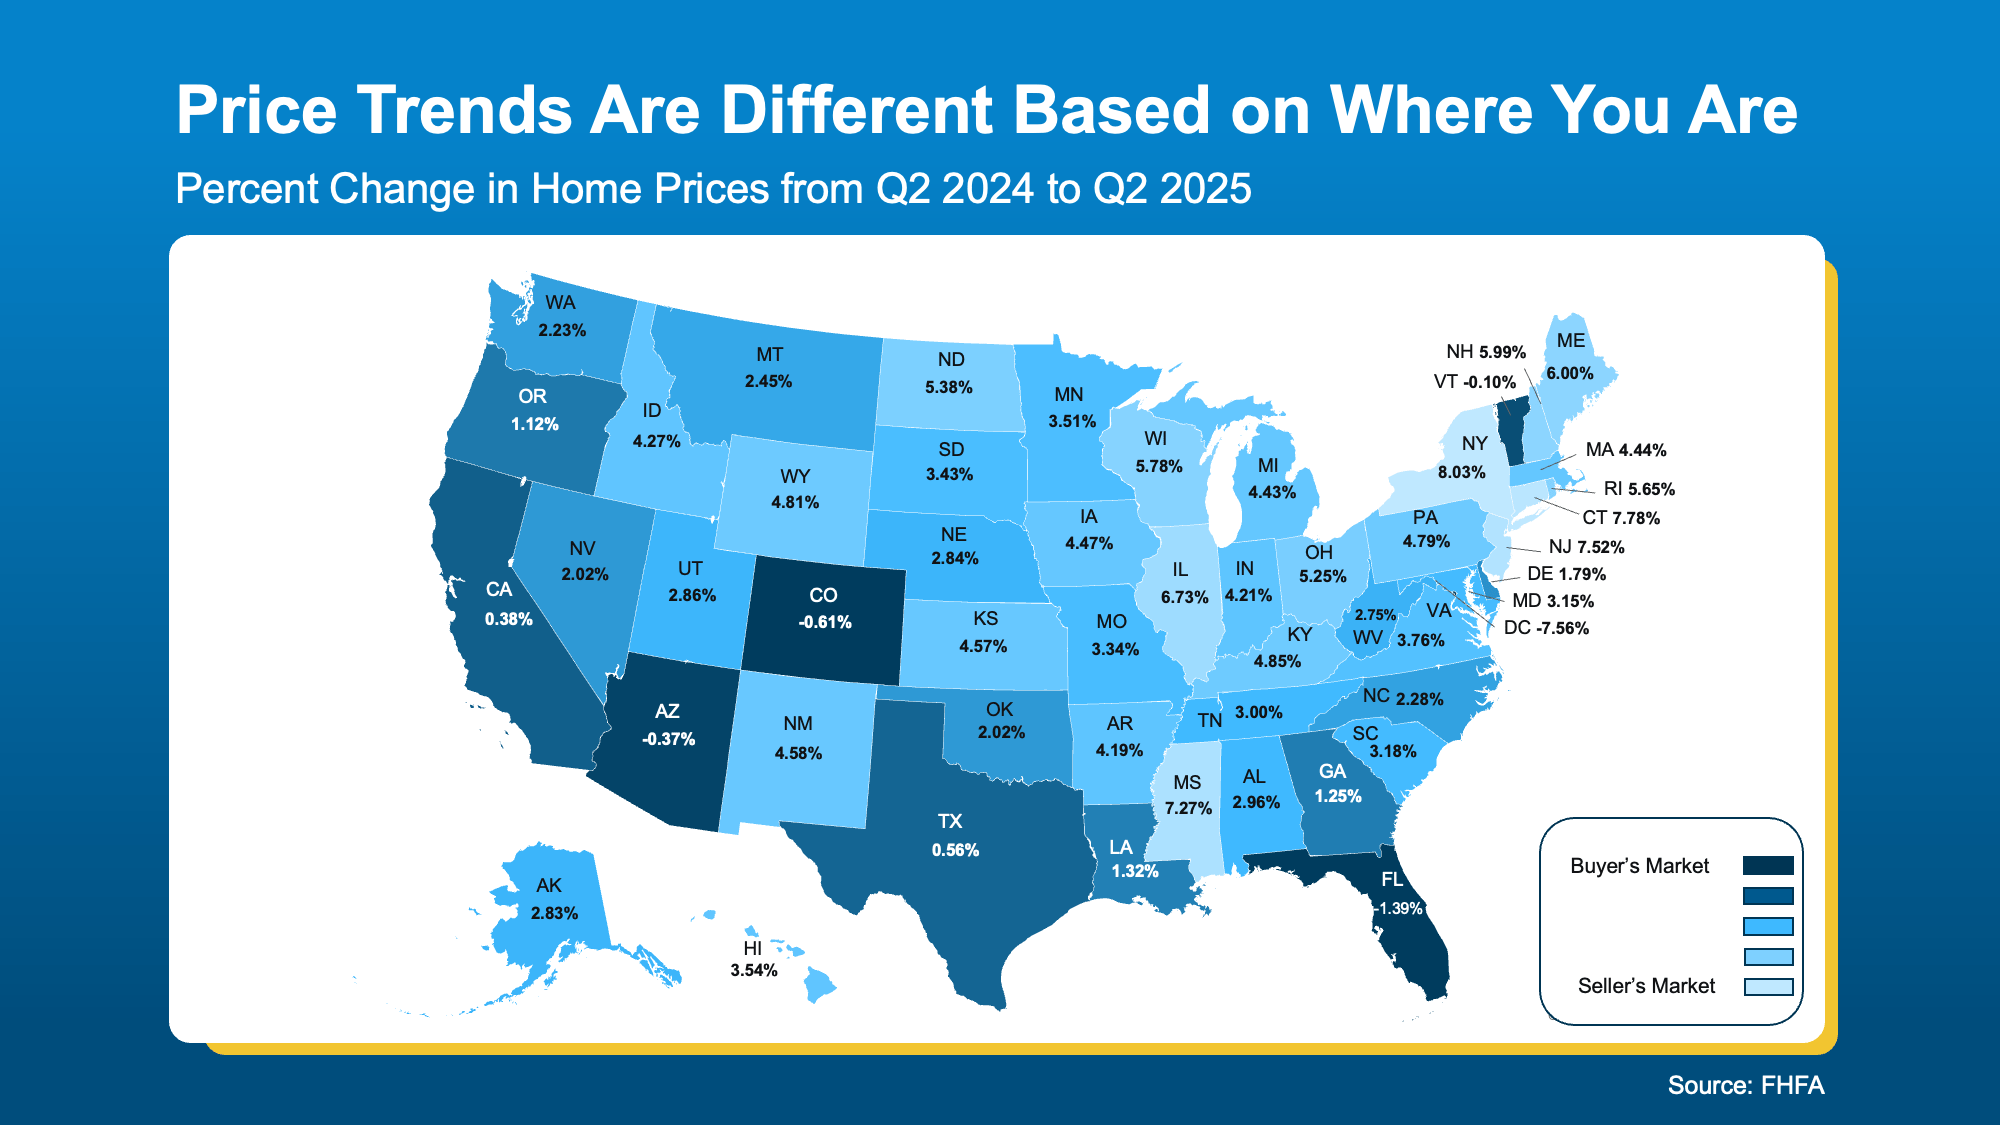
Time on Market Tells the Same Story

Finally, here’s how quickly homes are selling state by state. See the colors? For the most part, they follow the same general pattern with a lot of the darker blues being in the lower half of the country. And here’s why.

Generally speaking, as inventory grows, homes don’t sell as quickly. That’s why some of the same areas that have more inventory, see homes take more time to sell. 

  • The darker blues show where homes are staying on the market longer. That gives buyers more time and options, and signals sellers may need to adjust their expectations.
  • The lighter blues are where homes are still moving quickly. Sellers there may feel more confident, and buyers may need to act fast.

a map of the united statesThis explains why some sellers in these darker blue states are feeling frustrated when their listings linger, while others in tighter markets (like the lighter blue states) are still seeing their homes sell quickly.

Why an Agent’s Local Expertise Is the Key To Unlocking Today’s Market

Basically, the housing market is experiencing a divide. And conditions are going to vary a lot based on where you live, where you’re moving, and if you’re buying or selling. While the state-level information helps, what really matters is what’s happening in your town and your neighborhood. And only a local agent truly has the information you need.

Bottom Line

Want to know what conditions look like in your neighborhood?

If you want to understand which side of the market you’re on, connect with a local agent. They’ll walk you through the numbers and what they mean for your next move.

3 Reasons Affordability Is Showing Signs of Improvement This Fall

3 Reasons Affordability Is Showing Signs of Improvement This Fall Simplifying The Market

For the past couple of years, it’s been tough for a lot of homebuyers to make the numbers work. Home prices shot up. Mortgage rates too. And a number of people hit pause because it just didn’t feel possible. Maybe you were one of them.

But there’s some encouraging news. If you’ve been waiting for a better time to jump back in, affordability may finally be showing signs of improvement this fall.

The latest data from Redfin shows the typical monthly mortgage payment has been coming down, and is now about $290 lower than it was just a few months ago (see graph below):

a graph of a graph of a mortgage paymentAnd here’s why this is happening. The cost of buying a home really comes down to three things:

  • Mortgage rates
  • Home prices
  • Your wages

Right now, all three are finally moving in a better direction for you. While that doesn’t mean it’s suddenly easy to buy at today’s rates and prices, it does mean it’s not as challenging.

1. Mortgage Rates

Mortgage rates have come down compared to earlier this year. In May, they were roughly 7%. And now, they’re closer to 6.3% (see graph below):

a graph showing a line of interestThat may not sound like a big deal, but it does matter. Even small changes in rates can make a difference in your future monthly payment. Compared to when rates were 7%, if you take out an average $400K mortgage now at 6.3%, it’ll cost about $190 less a month based on just rates alone.

And for some people, that’s been enough to make buying a home possible again. As Joel Kan, VP and Deputy Chief Economist at the Mortgage Bankers Association (MBA), explained on September 10th:

The downward rate movement spurred the strongest week of borrower demand since 2022 . . . Purchase applications increased to the highest level since July and continued to run more than 20 percent ahead of last year’s pace.”

2. Home Prices

After several years of prices rising very rapidly, price growth has finally slowed. As Odeta Kushi, Deputy Chief Economist at First American, puts it:

“National home price growth remains positive, but muted — low single digits — and we expect this trend to continue in the second half of the year.

For buyers, that’s actually a big relief. That moderation makes it easier to plan your budget. And in some markets, prices have even dipped slightly. If you’re in one of the markets, you may be able to find something that’s more affordable than you’d expect.

3. Wages

According to the Bureau of Labor Statistics (BLS), wages are up near 4% annually. Lawrence Yun, Chief Economist at NAR, explains why that number is so important right now:

“Wage growth is now comfortably outpacing home price growth, and buyers have more choices.”

In other words, the typical paycheck is rising faster than home prices right now, which helps make buying a little more affordable. Now, it’s not a big difference, but in a market like this, every bit counts.

What This Means for You

Lower rates, slower price growth, and stronger wages might be enough to make the numbers finally work for you this fall. 

While affordability is still tight, it’s a little easier on your wallet to buy now than it was just few months ago. Remember, data from Redfin shows the typical monthly mortgage payment is already around $290 lower than it was earlier this year.

Bottom Line

Have you been wondering if it’s worth taking another look at buying?

Work with a professional to re-run the numbers. Together you can go over your budget, see what’s changed, and figure out if this fall is the time to turn window-shopping into key-turning.

What a Fed Rate Cut Could Mean for Mortgage Rates

What a Fed Rate Cut Could Mean for Mortgage Rates Simplifying The Market

The Federal Reserve (the Fed) meets this week, and expectations are high that they’ll cut the Federal Funds Rate. But does that mean mortgage rates will drop? Let’s clear up the confusion.

The Fed Doesn’t Directly Set Mortgage Rates

Right now, all eyes are on the Fed. Most economists expect they’ll cut the Federal Funds Rate at their mid-September meeting to try to head off a potential recession.

According to the CME FedWatch Tool, markets are already betting on it. There’s virtually a 100% chance of a September cut. And based on what we know now, there’s about a 92% chance it’ll be a small cut (25 basis points) and an 8% chance it will be a bigger cut (50 basis points):

a graph of a graph of a companySo, what exactly is the Federal Funds Rate? It’s the short-term interest rate banks charge each other. It impacts borrowing costs across the economy, but it’s not the same thing as mortgage rates. Still, the Fed’s actions can shape the direction mortgage rates take next.

Why Markets Already Saw This Cut Coming

Here’s the part that may surprise you. Mortgage rates tend to respond to what the financial markets think the Fed will do, before the Fed officially acts. Basically, when markets anticipate a Fed cut, that outlook gets priced into mortgage rates ahead of time.

That’s exactly what happened after weaker-than-expected jobs reports on August 1 and September 5. Each time, mortgage rates ticked down as financial markets grew more confident a cut was coming soon. And even though inflation rose slightly in the latest CPI report, the Fed is still expected to make a cut.

So, if the Fed goes with a 25-basis point cut, as expected, that’s likely already baked in to current mortgage rates, and we may not see a dramatic drop.

But if they go bigger and drop their Federal Funds Rate by 50 basis points instead, mortgage rates could come down more than they already have.

So, Where Do Mortgage Rates Go from Here?

While the upcoming cut may not move the needle much, many experts expect the Fed could cut the Federal Funds Rate more than once before the end of the year. Of course, that’s if the economy continues to cool (see graph below):

a graph of cut cutsAs Sam Williamson, Senior Economist at First American, explains:

“For mortgage rates, investor confidence in a forthcoming rate-cutting cycle could help push borrowing costs lower in the back half of 2025, offering some relief to housing affordability and potentially helping to boost buyer demand and overall market activity.”

If multiple rate cuts happen, or even if markets just believe they will, mortgage rates could ease further in the months ahead. But here’s the catch – all of this depends on how the economy evolves. Surprise inflation data or unexpected shifts could quickly change the outlook.

Bottom Line

Mortgage rates likely won’t drop sharply overnight, and they won’t mirror the Fed’s moves one-for-one. But if the Fed begins a rate-cutting cycle, and markets continue to expect it, mortgage rates could trend lower later this year and into 2026.

If you’ve been waiting and watching the housing market, now’s the time to talk strategy. Even small changes in rates can make a meaningful difference in affordability, and understanding what’s ahead helps you make the best decision for your situation.

Mortgage Rates Just Saw Their Biggest Drop in a Year

Mortgage Rates Just Saw Their Biggest Drop in a Year Simplifying The Market

You’ve been waiting for what feels like forever for mortgage rates to finally budge. And last week, they did – in a big way.

On Friday, September 5th, the average 30-year fixed mortgage rate fell to the lowest level since October 2024. It was the biggest one-day decline in over a year.

What Sparked the Drop?

According to Mortgage News Daily, this was a reaction to the August jobs report, which came out weaker-than-expected for a second month in a row. That sent signals across the financial markets, and then mortgage rates came down as a result.

Basically, we’re seeing signs the economy may be slowing down, and as certainty grows in the direction the economy is going, the markets are reacting to what is likely ahead. That historically brings mortgage rates down.

Why Buyers Should Pay Attention Now

But this isn’t just about one day of headlines or one report. It’s about what the drop means for you.

This recent change saves you money when you buy a home. The chart below shows you an example of what a monthly mortgage payment (principal and interest) would be at 7% (where mortgage rates were in May) versus where rates roughly are now:

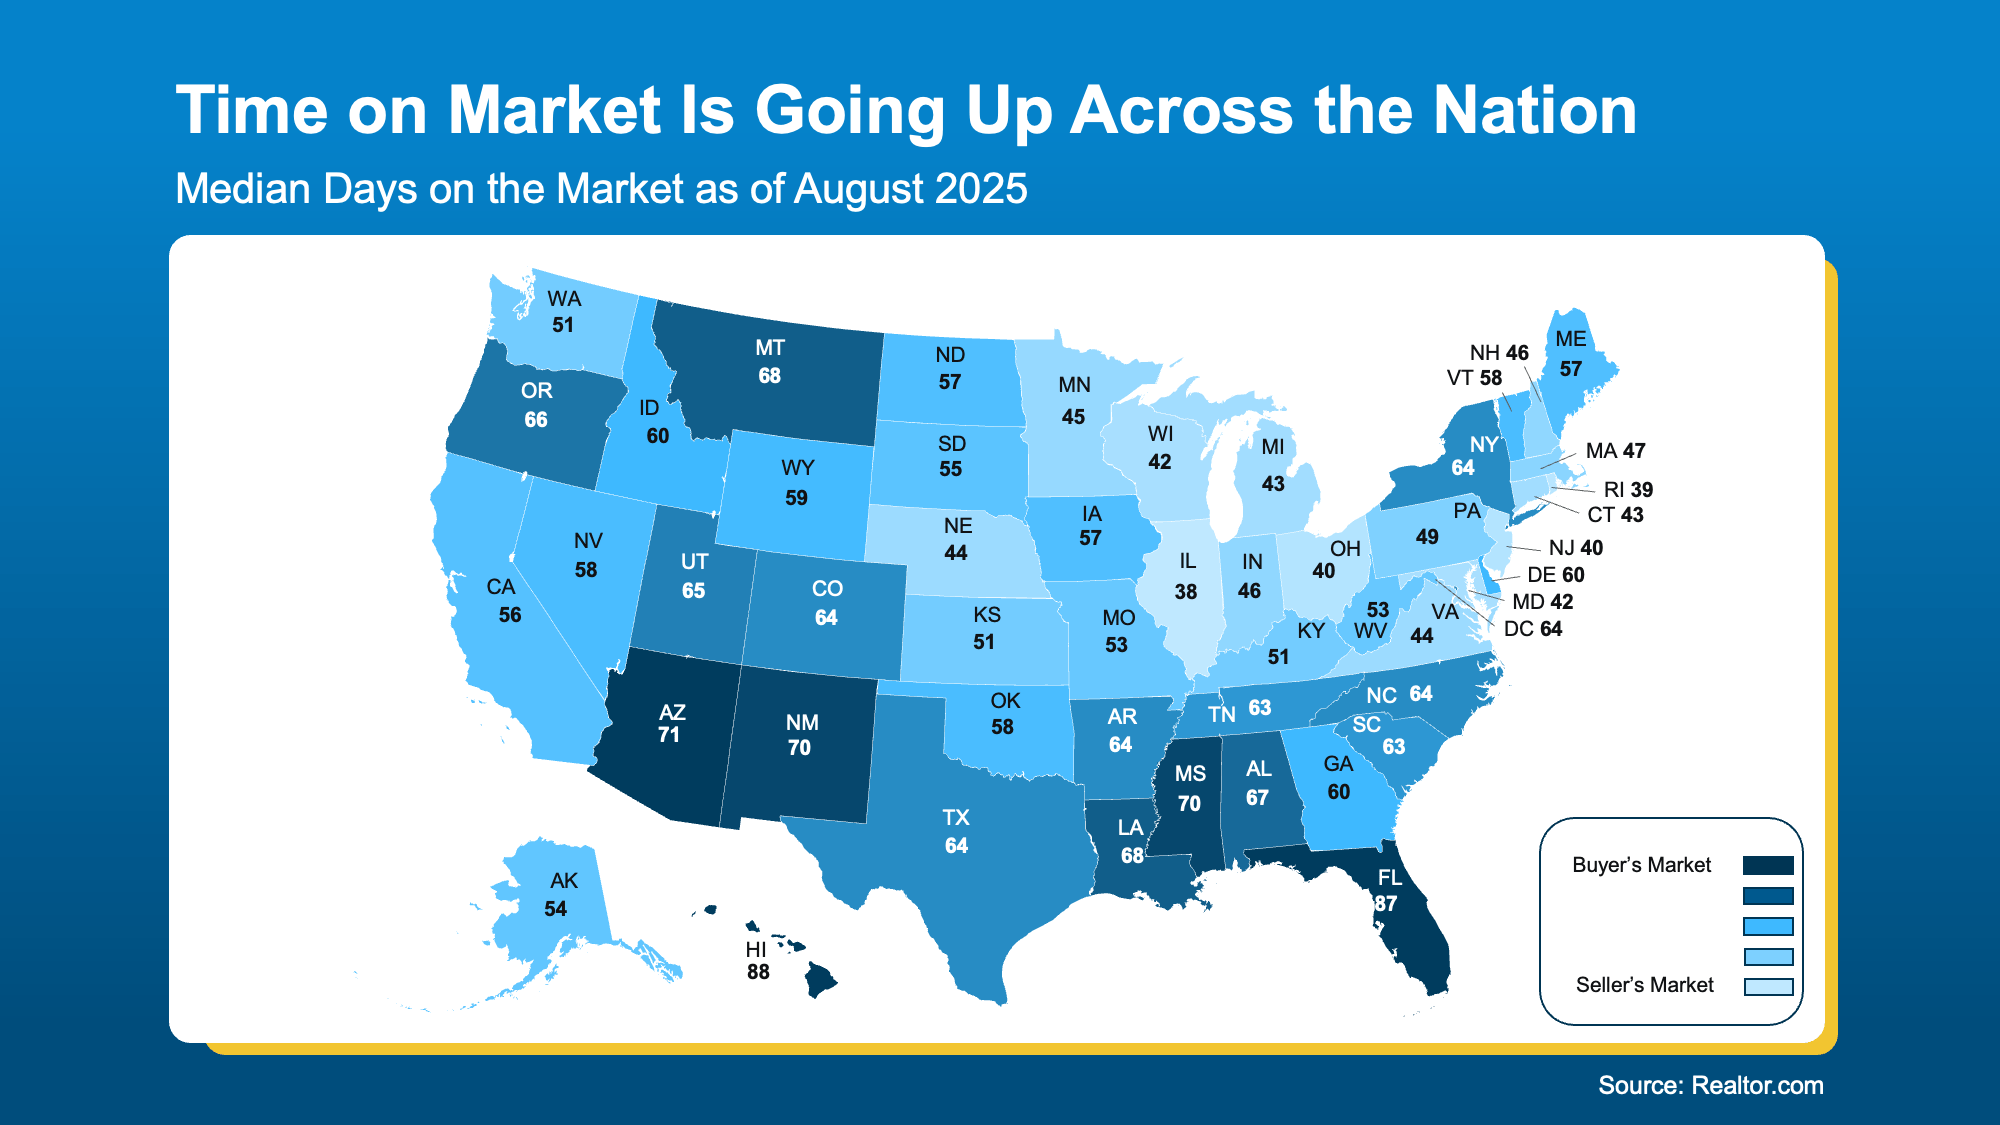
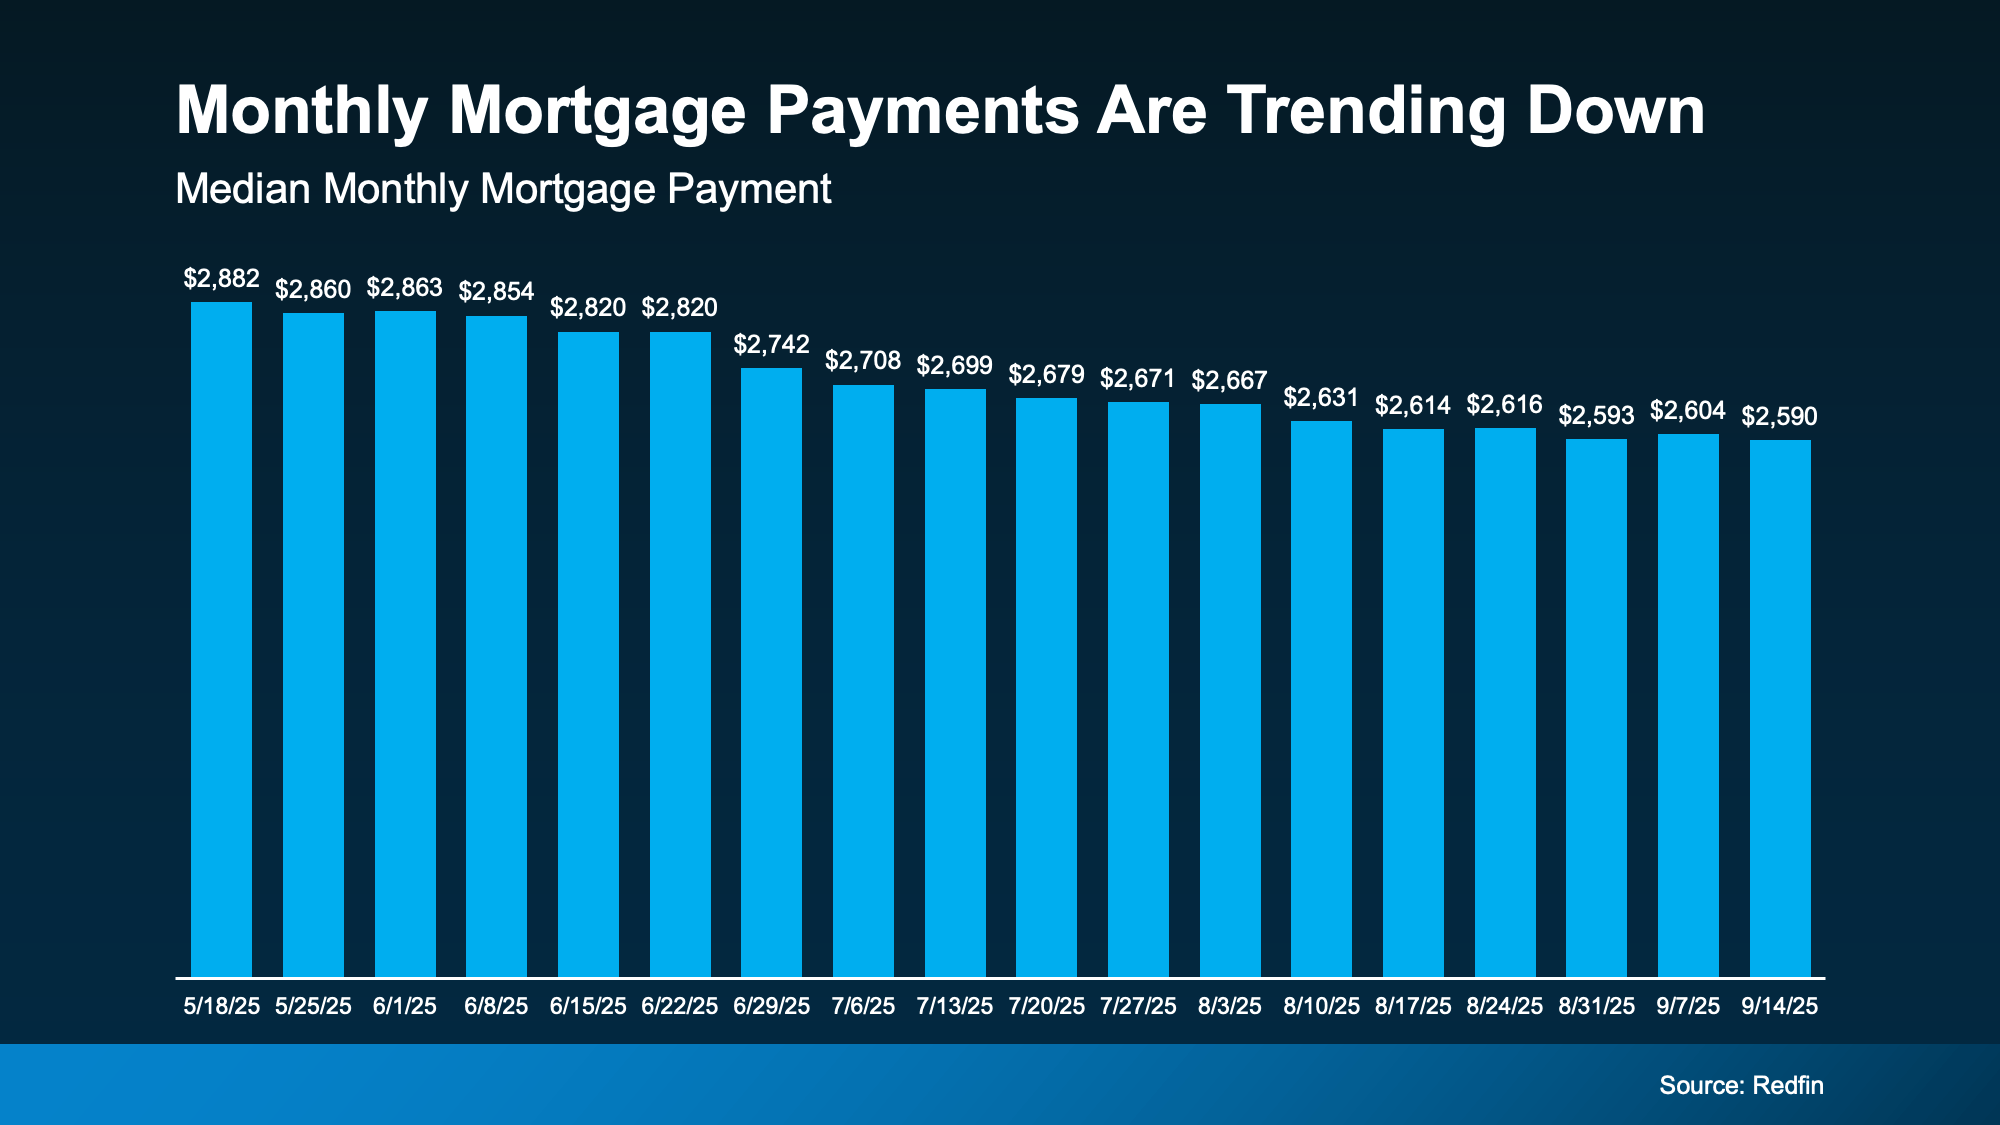
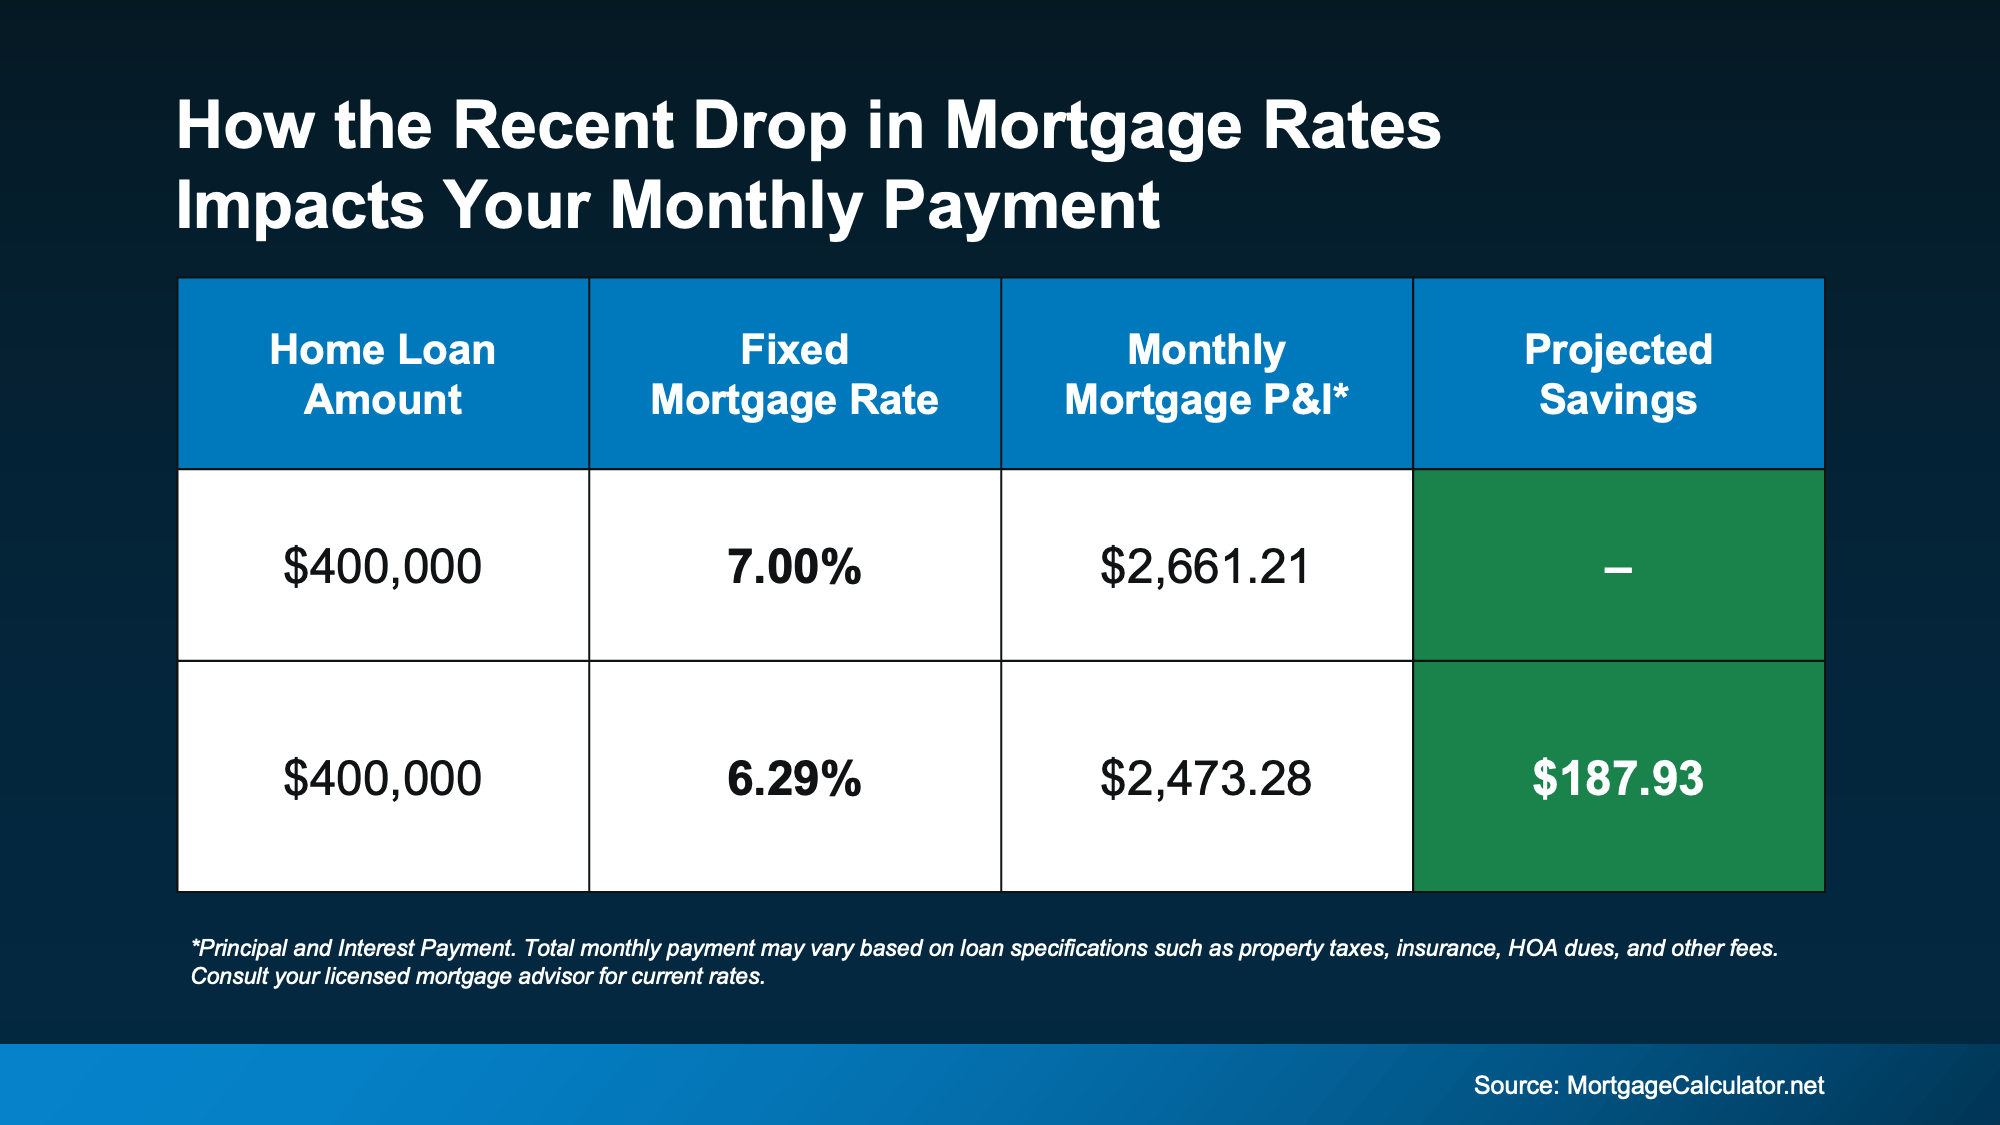
Compared to just 4 months ago, your future monthly payment would be almost $200 less per month. That’s close to $2,400 a year in savings.

How Long Will It Last?

That really depends on where the economy and inflation go from here. Rates could drop lower, or they could inch up slightly. 

So, make sure you’re connected with a good agent and trusted lender. They’ll keep a close eye on inflation indicators, job market updates, and reactions to upcoming Fed policy to gauge where mortgage rates may go from here.

But for now, focus on this. While no one can say for sure where rates are headed, the fact that rates broke out of their months-long rut is a good thing. If you’ve been feeling stuck, this could make the start of a new chapter. As Diana Olick, Senior Real Estate and Climate Correspondent at CNBC, says:

“Rates are finally breaking out of the high 6% range, where they’ve been stuck for months.” 

And that’s gives you more reason to hope than you’ve had in quite some time.

Bottom Line

This is the shift you’ve been waiting for.

Mortgage rates just saw their biggest decline in over a year. And if rates stay near this level, it could make a home you couldn’t afford just a few months ago feel possible again.

What would today’s rates save you on your future monthly payment? Connect with an agent or lender so you can find out.

Builder Incentives Reach 5-Year High

Builder Incentives Reach 5-Year High Simplifying The Market

Even with more homes on the market right now, some buyers are still having a tough time finding the right one at the right price. Maybe the layout feels off. Maybe it still needs some updating. Or maybe it’s just more of the same.

That’s why more buyers are turning to new construction – and finding some of the best deals available today.

Why? Today, many builders have more homes that are finished and sitting on the market than normal. And that means they’re motivated to sell. They’re running a business, and they don’t want to sit on their inventory. They want to sell it before they build more homes. And that can definitely work in your favor.

As Lance Lambert, Co-Founder of ResiClub, puts it:

“In housing markets where unsold completed inventory has built up, many homebuilders have pulled back on their spec builds—and many are doing bigger incentives or outright price cuts to move unsold inventory.”

Incentives Are the Highest They’ve Been in 5 Years

Data from the National Association of Home Builders (NAHB) shows 66% of builders offered sales incentives in August. That’s the peak so far this year, and the highest percentage we’ve seen in 5 years.

a graph of blue rectangular bars with numbersThat means 2 out of every 3 builders are offering something extra to get deals done. And when builders throw in incentives, it’s the buyers like you who win.

Price Cuts Are Back on the Table

One of the most common incentives they’re offering right now is adjusting the price. According to NAHB, almost 40% of builders are doing price cuts (see graph below):

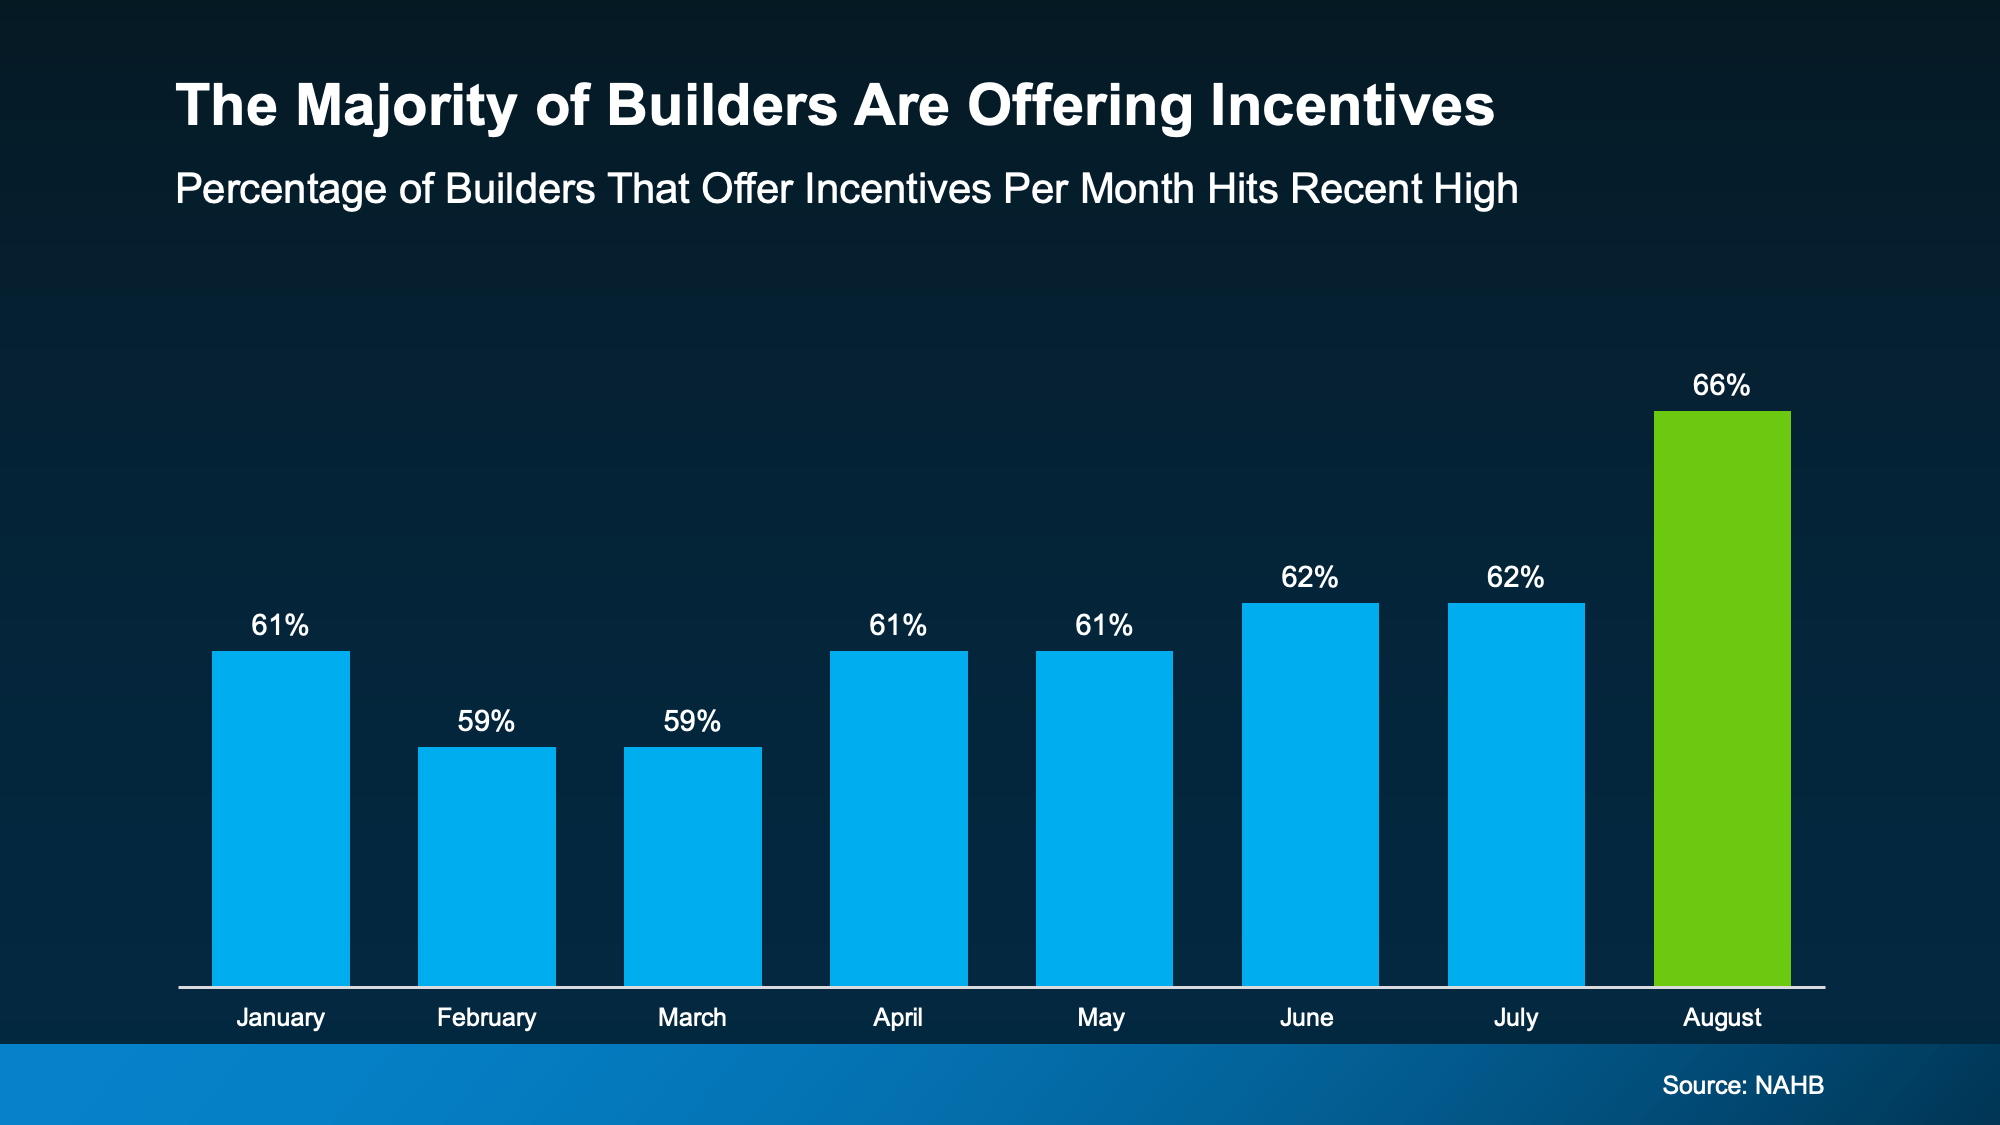
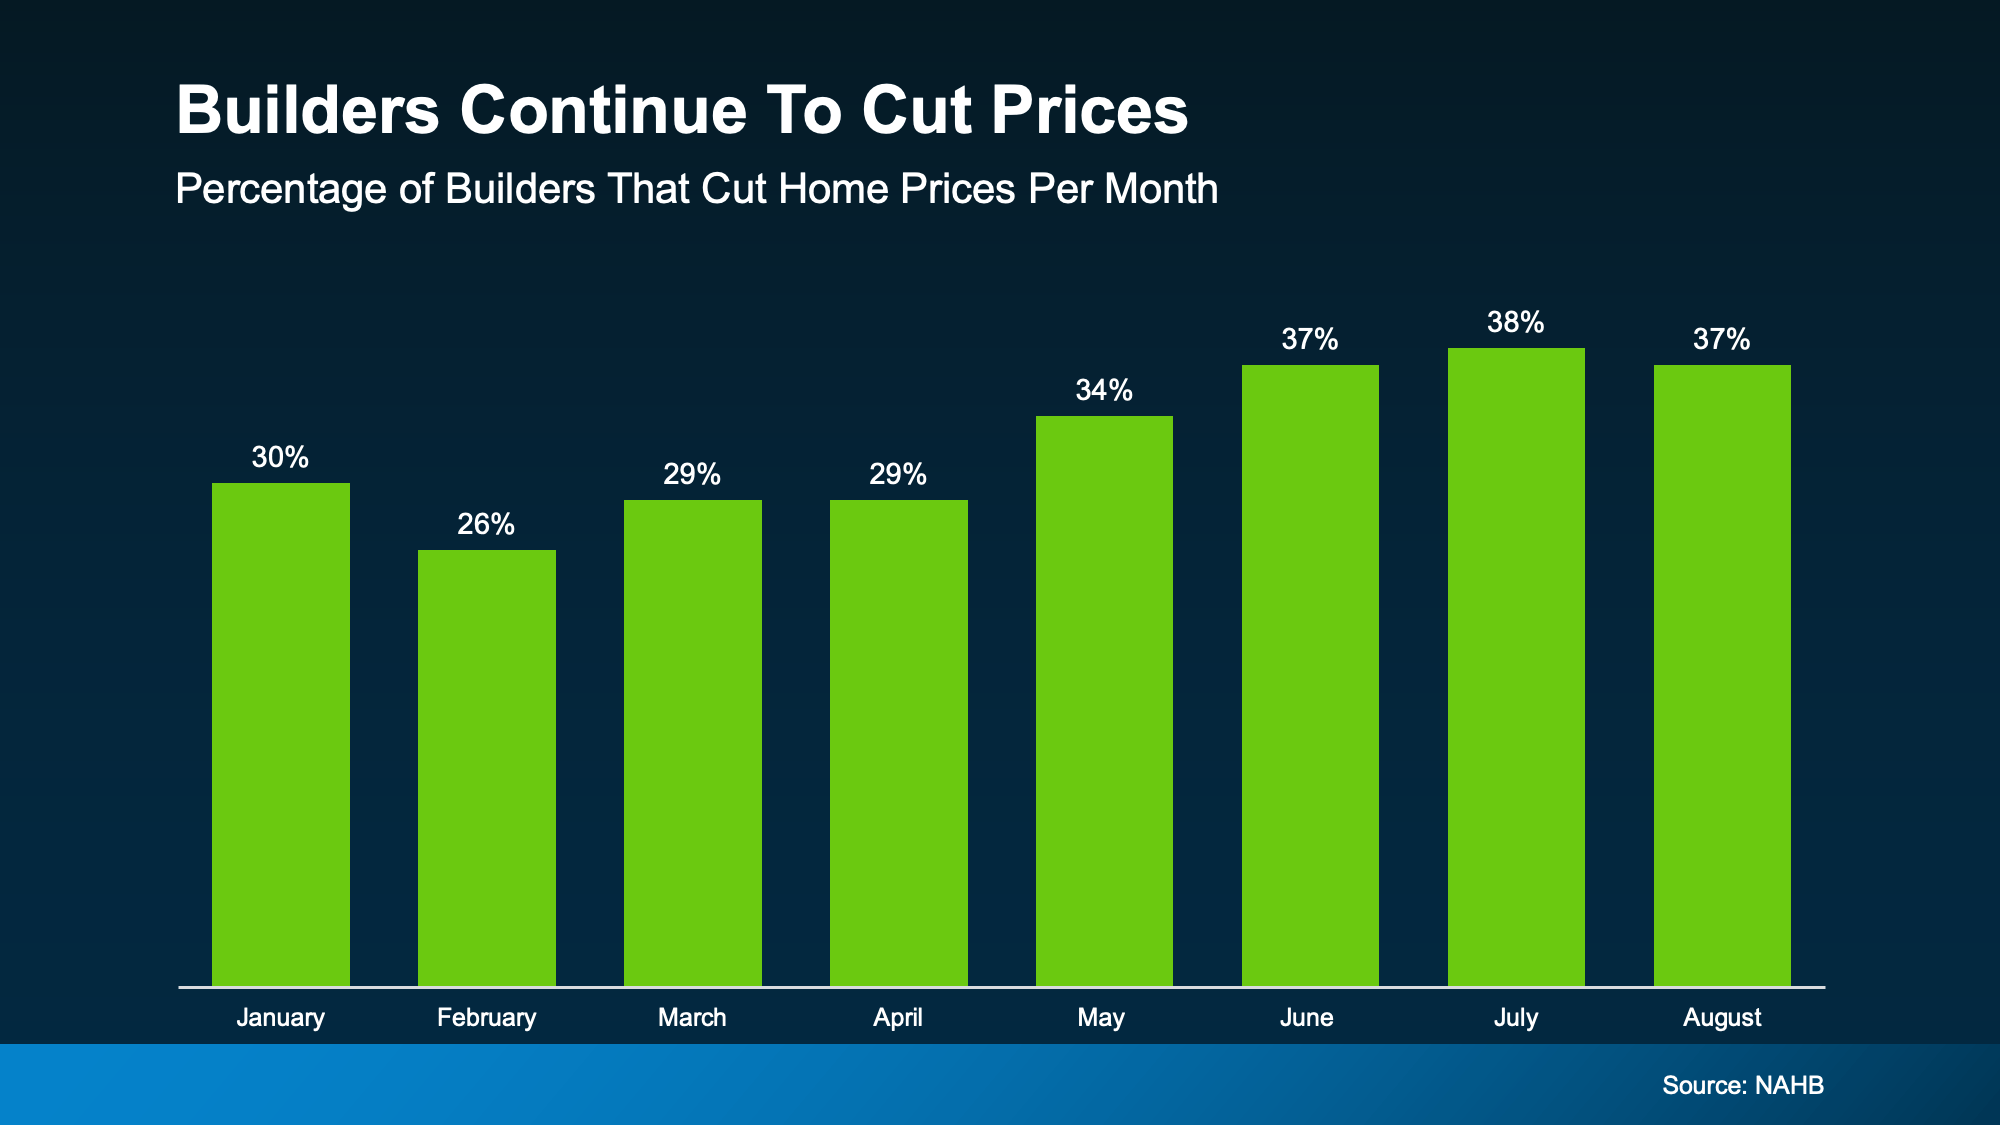
On average they’re taking off about 5% off the purchase price of the house. For a buyer, 5% could be the difference between reluctantly settling and finally getting a home that works for you.

Take a $500,000 house as an example. If builders reduce the price by 5%, you’re saving $25,000.

And even if the builder you’re interested in won’t budge on price, they’ve got plenty of other levers to pull. As Realtor.com explains: 

“. . . there are deals to be found in the market for new homes, with builders increasingly willing to negotiate on price or offer incentives such as rate buydowns and closing cost assistance.”

Why This Matters for You

As a buyer, you probably have a clear vision for your ideal home. Because you’re not just buying any house. You’re buying your house. The one with the space, features, and lifestyle you’ve been hoping for. New builds can check those boxes since they usually have: 

  • Bigger kitchens and open layouts
  • Energy efficiency (hello lower utility bills)
  • Smart-home upgrades
  • Fewer repair headaches on day one

And today’s incentives make buying a new home more attainable than it’s been in years.

One Word of Advice: Don’t Go At It Alone

If you want to take advantage of this opportunity, just be sure to use your own agent. Builder reps aren’t there to save you money. They protect the builder’s bottom line. That’s why you need to bring your agent with you. Your agent will:

  • Cut through the sales pitch and run the cold hard numbers
  • Spot which incentives are actually worth it (and which ones are fluff)
  • Handle negotiations so you walk away with the best deal possible
  • Keep your best interest as their top priority

Bottom Line

If you’re not finding a home you love, the new home market is buzzing with opportunity. With record-high incentives, price cuts in play, and builders itching to move inventory, this is the best time in years to buy new construction.

Curious how far today’s incentives could stretch your budget? Connect with an agent to see what builders are offering in your area.

What Mortgage Delinquencies Tell Us About the Future of Foreclosures

What Mortgage Delinquencies Tell Us About the Future of Foreclosures Simplifying The Market

You may be seeing headlines about how foreclosures are rising. And if that makes you nervous that we’re headed for another crash, here’s what you should know. 

According to ATTOM, during the housing crash, over nine million people went through some sort of distressed sale (2007-2011). Last year, there were just over 300,000.

So, even with the increase lately, we’re talking about numbers that are dramatically lower. But what does the future hold? Is a wave coming? The short answer is, no.

Here’s why. Experts in the industry look at mortgage delinquencies (loans that are more than 30 days past due) as an early sign for potential foreclosures down the line. And the latest data for delinquencies is reassuring about the market overall.

Right now, delinquencies as a whole are consistent with where we ended last year, which means we’re not seeing the kind of increase that would signal widespread trouble.

But there are some key indicators to continue to watch. Marina Walsh, Vice President of Industry Analysis at the Mortgage Bankers Association, explains:

“While overall mortgage delinquencies are relatively flat compared to last year, the composition has changed.”

Right now, borrowers with FHA mortgages currently make up the biggest share of new delinquencies (see graph below):

a graph of a number of peopleAnd here’s why that may be happening. Borrowers with FHA mortgages may be more sensitive to shifts in the economy. And with recession fears, stubborn inflation, employment challenges, and more, it makes sense this segment of the market may be feeling it a bit more. But that doesn’t mean it’s a signal a crash is coming.

If you look back at the graph, it shows, while there are more FHA loans experiencing hardship than the norm, delinquency rates for other loan types remain low and stable. Back during the crash, delinquency rates were significantly elevated for all 4 categories.

That means the broader mortgage market is on much stronger footing than it was back in 2008. As ResiClub says:

“The recent uptick in mortgage delinquency seems to be concentrated among FHA borrowers, however, mortgage performance remains very solid when viewed in light of the twenty-year history of our data.”

The Region with the Most FHA Loans

Here’s another reason this isn’t a signal of trouble ahead. FHA loans only make up about 12% of all home loans nationwide. But like anything else in housing, local data matters. There are some regions of the country where there are more of this type of loan than others, particularly the South.

The map below does not show how many FHA loans are delinquent. It just shows the overall concentration of FHA loans by state, so you can see which regions have the greatest volume (see map below):

a map of the united statesAs the Federal Reserve Bank of New York explains:

“Looking at geographic concentrations of loans, recent data indicate that a higher proportion of mortgage balances are delinquent in many of the southern states . . . we see that higher delinquency rates coincide with a higher share of FHA loans across states.”

Just remember, even the delinquencies rates we’re seeing now aren’t as high as they were in 2008. Again, this is not a signal of a crisis. But it is something experts will monitor in the months ahead. 

If You’re Experiencing Financial Hardship

No one wants to see anyone face the challenges of foreclosure. But just know that, if you’re a homeowner struggling with payments, you’re not alone – and you do have options.

The first step is reaching out to your mortgage provider. In many cases, you may be able to set up a repayment plan or explore loan modifications to help you stay on track. And for many homeowners today, you may also have enough equity to sell your house and avoid foreclosure. Odds are, at least some of these delinquencies will go that route since homeowners today have near record amounts of equity in their homes. It may be worth seeing if that could be an option for you too.

Bottom Line

Foreclosures are rising slightly, but they’re nowhere near the levels of 2008. And delinquency trends don’t point to a crash ahead.

This is something industry professionals are going to watch in the days ahead. If you want to stay up to date, connect with an agent or lender so you always have the latest information.

What Everyone’s Getting Wrong About the Rise in New Home Inventory

What Everyone’s Getting Wrong About the Rise in New Home Inventory Simplifying The Market

You may have seen talk online that new home inventory is at its highest level since the crash. And if you lived through the crash back in 2008, seeing new construction is up again may feel a little scary.

But here’s what you need to remember: a lot of what you see online is designed to get clicks. So, you may not be getting the full story. A closer look at the data and a little expert insight can change your perspective completely.

Why This Isn’t Like 2008

While it’s true the number of new homes on the market hit its highest level since the crash, that’s not a reason to worry. That’s because new builds are just one piece of the puzzle. They don’t tell the full story of what’s happening today.

To get the real picture of how much inventory we have and how it compares to the surplus we saw back then, you’ve got to look at both new homes and existing homes (homes that were lived in by a previous owner).

When you combine those two numbers, it’s clear overall supply looks very different today than it did around the crash (see graph below):

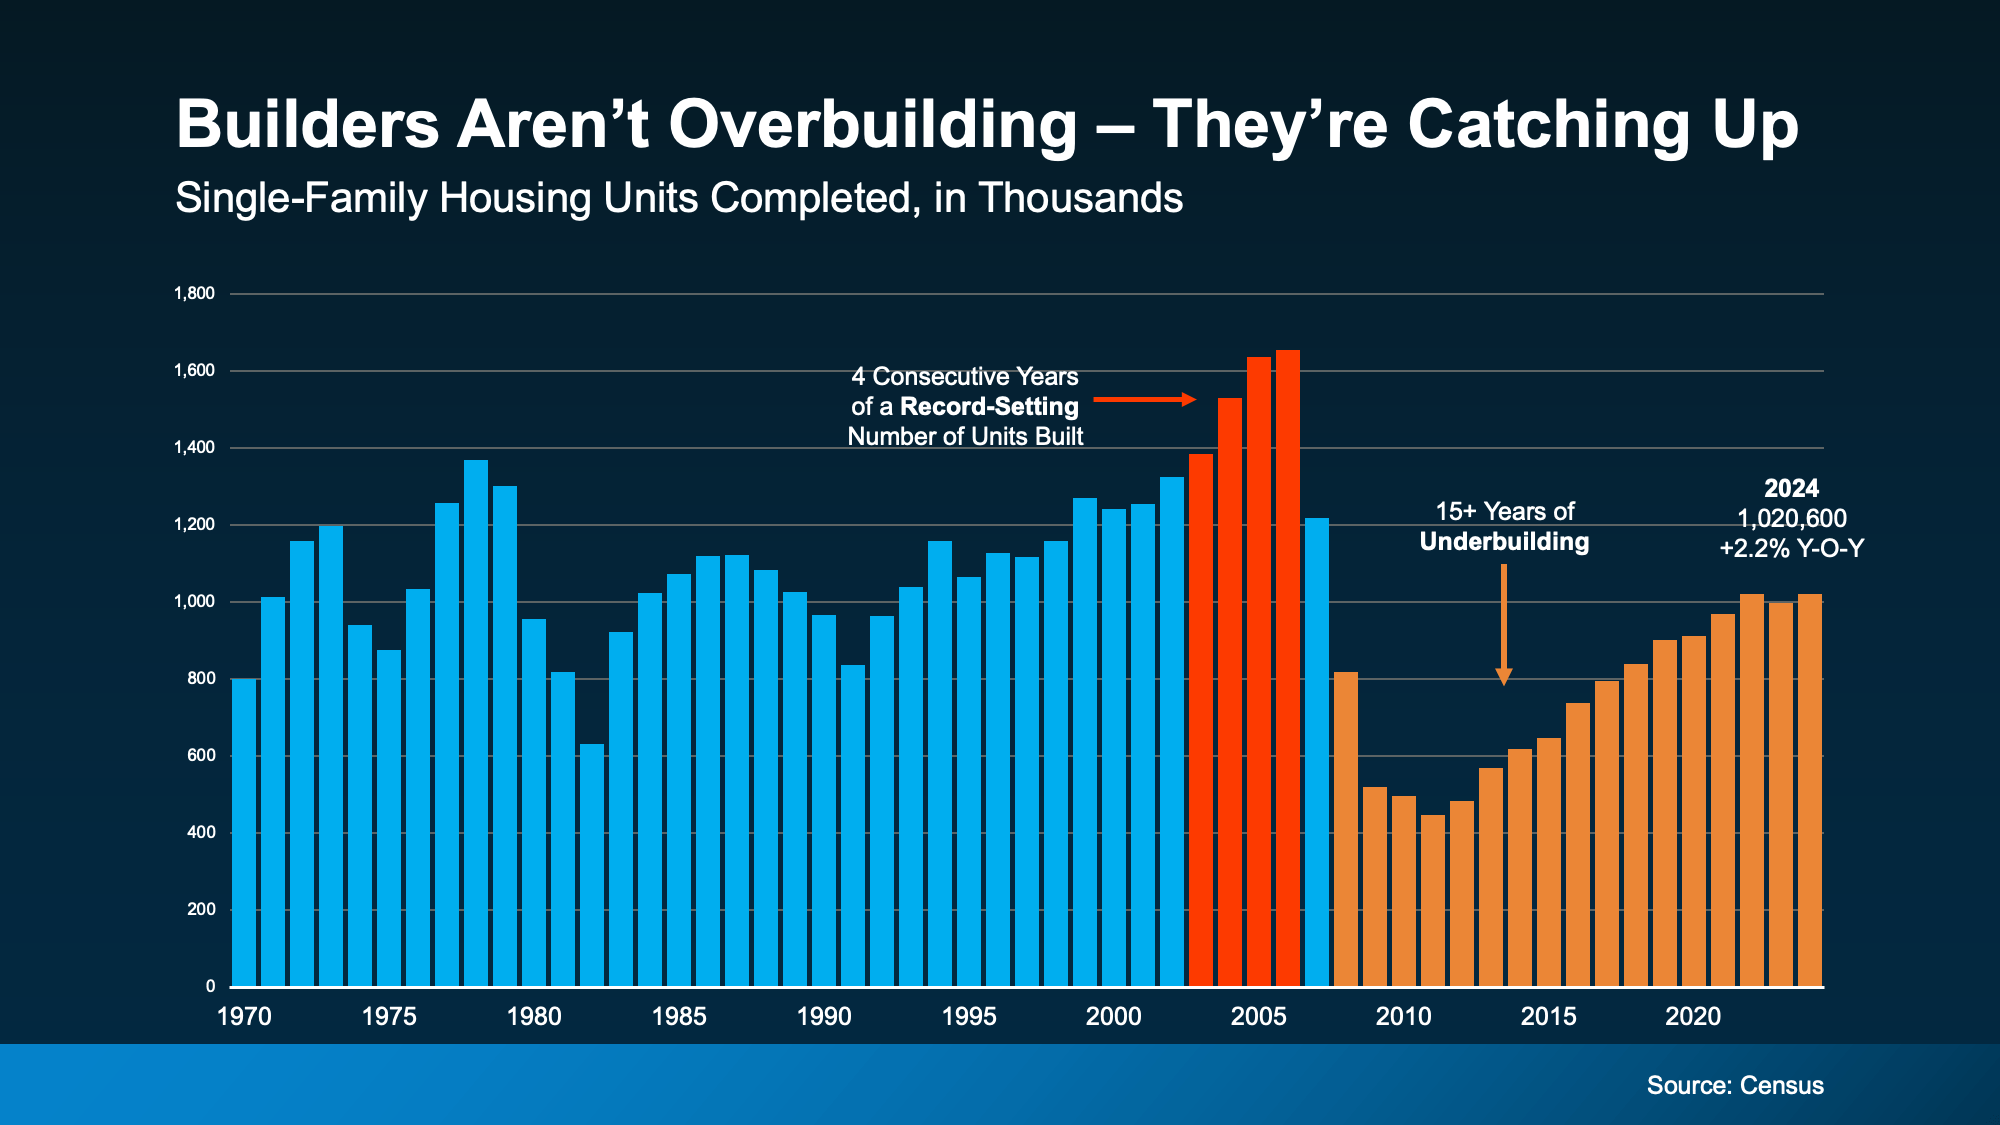
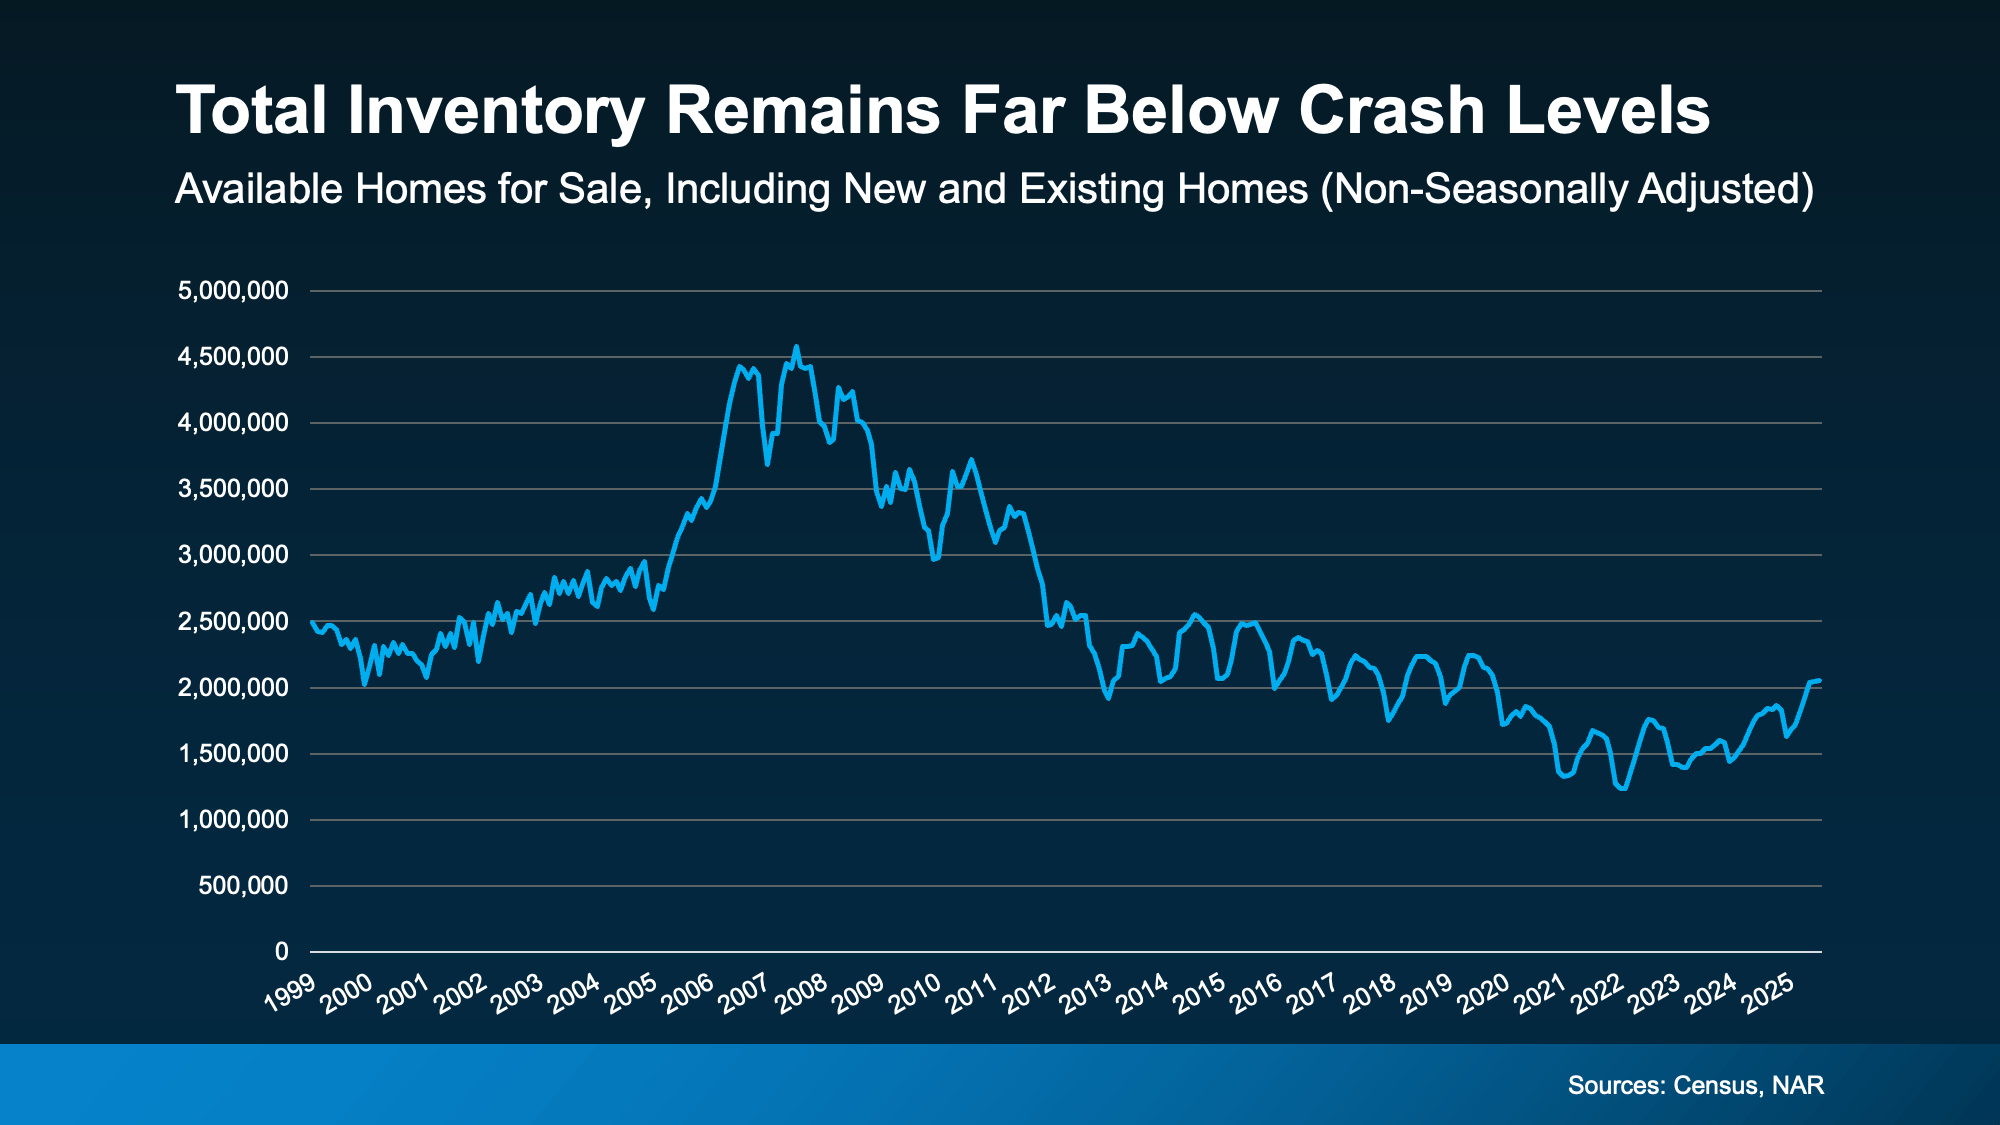
So, saying we’re near 2008 levels for new construction isn’t the same as the inventory surplus we did the last time.

Builders Have Actually Underbuilt for Over a Decade

And here’s some other important perspective you’re not going to get from those headlines. After the 2008 crash, builders slammed on the brakes. For 15 years, they didn’t build enough homes to keep up with demand. That long stretch of underbuilding created a major housing shortage, which we’re still dealing with today.

The graph below uses Census data to show the overbuilding leading up to the crash (in red), and the period of underbuilding that followed (in orange):

a graph of a number of unitsBasically, we had more than 15 straight years of underbuilding – and we’re only recently starting to slowly climb out of that hole. But there’s still a long way to go (even with the growth we’ve seen lately). Experts at Realtor.com say it would roughly 7.5 years to build enough homes to close the gap.

Of course, like anything else in real estate, the level of supply and demand is going to vary by market. Some markets may have more homes for sale, some less. But nationally, this isn’t like the last time.

Bottom Line

Just because there are more new homes for sale right now, it doesn’t mean we’re headed for a crash. The data shows today’s overall inventory situation is different.

If you have questions or want to talk about what builders are doing in your area, connect with a local agent.

Should You Still Expect a Bidding War?

Should You Still Expect a Bidding War? Simplifying The Market

If you’re still worried about having to deal with a bidding war when you buy a home, you may be able to let some of that fear go.

While multiple-offer situations haven’t disappeared entirely, they’re not nearly as common as they used to be. In fact, a recent survey shows agents reported only 1 in 5 homes (20%) nationally received multiple offers in June 2025.

That’s down from nearly 1 in 3 (31%) just a year ago – and dramatically lower than in June 2023 (39%) (see graph below):

a graph of a number of blue and green barsThis trend means you should face less competition when you buy. That gives you more time to make decisions and the ability to negotiate price or terms.

It Still Depends on Where You’re Buying

Of course, national trends don’t tell the full story. Local dynamics matter, a lot. This second graph uses survey data from John Burns Research & Consulting (JBREC) and Keeping Current Matters (KCM) to break things down by region to prove just how true that is. It shows, while the share of homes getting multiple offers has dropped pretty much everywhere, some areas are still seeing more offers than others:

a graph with numbers and textIn the Northeast, 34% of homes (roughly 1 in 3) are still receiving multiple offers. That’s more than the national average. But in Southeast, that number drops to just 6%. 

What’s behind the difference? In general, the areas still seeing bidding wars tend to have lower-than-normal inventory. That imbalance between buyers and available homes keeps pressure on prices and competition. But markets with more listings are seeing conditions cool – and that means fewer bidding wars. 

Sellers Are More Flexible Than You Might Think

Here’s another shift to show you just how much things have changed. According to a Redfin report, almost half of sellers are offering concessions, like covering their buyer’s closing costs or dropping their asking price to get their house sold.

That’s a clear sign this isn’t the same ultra-competitive market we saw a few years ago. Back then, sellers rarely compromised. And buyers often waived their inspection or appraisal to try to make their offer stand out. Now, things are different.

But again, how often this is happening is going to vary based on where you’re looking to buy. And that’s why you need a local agent’s expertise.

Bottom Line

If concerns about bidding wars have been holding you back, it may be time to take another look. Nationally, competition is down. In some markets, it’s down significantly. And with more sellers offering concessions, buyers today have more power and flexibility than they’ve had in a long time.

Want to find out what the market looks like where you’re buying? Connect with a local agent.

From Frenzy to Breathing Room: Buyers Finally Have Time Again

From Frenzy to Breathing Room: Buyers Finally Have Time Again Simplifying The Market

If you tried to buy a home a few years ago, you probably still remember the frenzy. Homes were listed one day and gone the next. Sometimes it only took hours. You had to drop everything to go and see the house, and if you hesitated even slightly, someone else swooped in and bought it – sometimes even sight unseen.

That kind of intensity pushed a lot of buyers to the sidelines. It was stressful, chaotic, and for many, really discouraging.

But here’s what you need to know: those days are behind us.

Today’s market is moving slower, in the best possible way. And that’s creating more opportunity for buyers who felt shut out in recent years.

The Stat That Changes Everything

According to the latest data, homes are spending an average of 58 days on the market. That’s much more normal. And it’s a big improvement compared to the height of the pandemic, when homes were flying off the shelves in a matter of days (see graph below):

a graph of blue bars with white textThat means you now have more time to make decisions than you have at any point in the past five years. And that’s a big deal. Now, you’ve got:

Time to think.

Time to negotiate.

Time to make a smart move without all the pressure.

More Time Means Less Stress (and More Leverage)

Based on the data in the graph above, you have an extra week to decide compared to last year. And nearly double the time you would have had at the market’s peak.

Back then, fear of missing out drove buyers to act fast, sometimes too fast. Today, the pace is slower, which means you’re in control. As Bankrate puts it:

“For years, buyers have been racing to snag homes because of the fierce competition. But the market’s cooled off a bit now, and that gives buyers some breathing room. Homes are staying listed longer, so buyers can slow down, weigh their options and make more confident decisions.”

With more homes on the market and fewer buyers racing to grab them, the balance has shifted. Bidding wars aren’t as common, and that means you may have room to negotiate. And you can actually take a breath before you make your decision.

More listings + a slower pace = less stress and more opportunity

But, and this is important, it still depends on where you’re buying. Nationally, homes are moving slower. But your local market sets your real pace. Some states are moving faster than others. It may even vary down to the specific zip code or neighborhood you’re looking at. And that’s why working with an agent to know what’s happening in your area is more important than ever. 

To see how your state compares to the national average (58 days), check out the map below:

a map of the united statesAs Realtor.com explains:

While national headlines might suggest a buyer’s market is taking hold, the reality on the ground depends heavily on where and what you’re trying to buy. Local trends can diverge sharply from national averages, especially when you factor in price range, property type, and post-pandemic market dynamics.”

A smart local agent can tell you exactly when to move fast and when you can take your time, so you never miss the right home for you.

Bottom Line

If the chaos of the past few years drove you to hit pause, this is your green light. The market’s pace has shifted. You have more time. More options. More power.

And with the right agent guiding you, you’re in the best position you’ve been in for years.

Connect with a local agent to talk about what the pace looks like in your area, and if now could be the right time for you to re-enter the market.