

Foreclosures are ticking up. And that may make your mind jump straight to thoughts of 2008 – specifically to what happened to the market during the housing crash. So, let’s do exactly what your brain already wants to do, and see if there’s any connection there.
The simple truth is foreclosure filings are rising. But they’re nowhere near crisis levels. And that’s not where they’re headed either. Here’s why.
Take a look at serious delinquencies – loans where the homeowner is more than 90 days late on their mortgage payments.
While those have increased slightly, data from the New York Fed shows they still remain low. And they aren’t anywhere close to levels seen when the market crashed (see graph below):
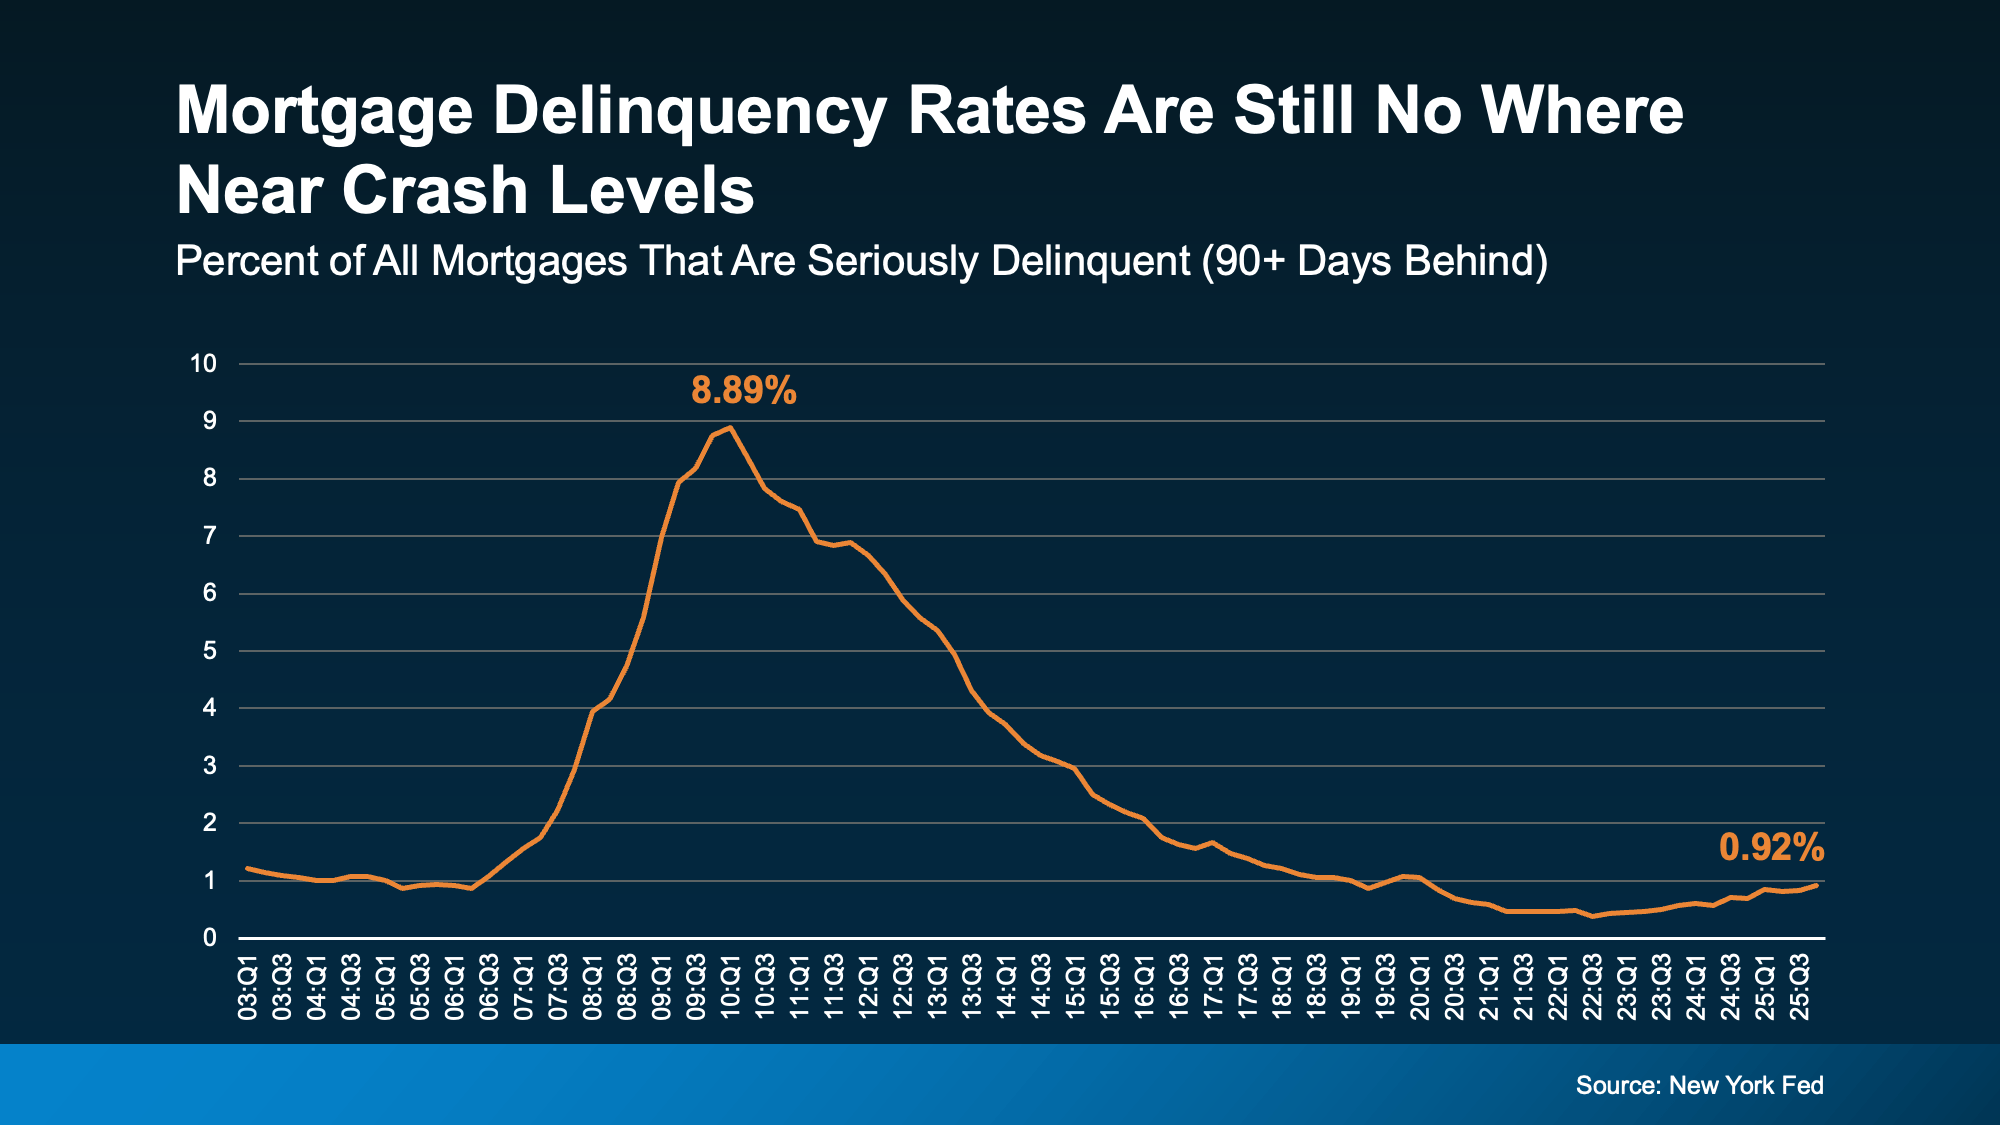 Right now, about 1% of mortgages are seriously delinquent. That’s only 1 in 100.
In the years around the crash, they were up around 9%. That’s 1 in 11.
That’s a big difference.
And it’s important to remember not all delinquencies even become foreclosure filings. Some homeowners who are falling behind will work out repayment plans with their banks and lenders because banks don’t want to see a wave of foreclosures either.
That’s why foreclosure numbers are even lower than delinquencies. ATTOM shows only 0.3% of all homes are currently going through a foreclosure filing. And those won’t even all go to a full foreclosure. That’s not a wave. That’s a ripple at most.
If People Are Falling Behind on Payments, Why Aren’t There Even More Foreclosures?
And maybe you’re wondering, if people are struggling financially, why aren’t there more foreclosures? Here’s the easiest way to answer that.
When households feel financial pressure, they tend to prioritize their mortgage payment above almost everything else. Because the last thing they want to lose is their home.
Data from the New York Fed shows serious delinquencies have risen more for credit cards and auto loans (the blue and green lines). But mortgage delinquencies and home equity lines of credit (borrowing against the value of your home) aren’t seeing the same big uptick (the yellow and orange lines). They’re a lot more stable overall.
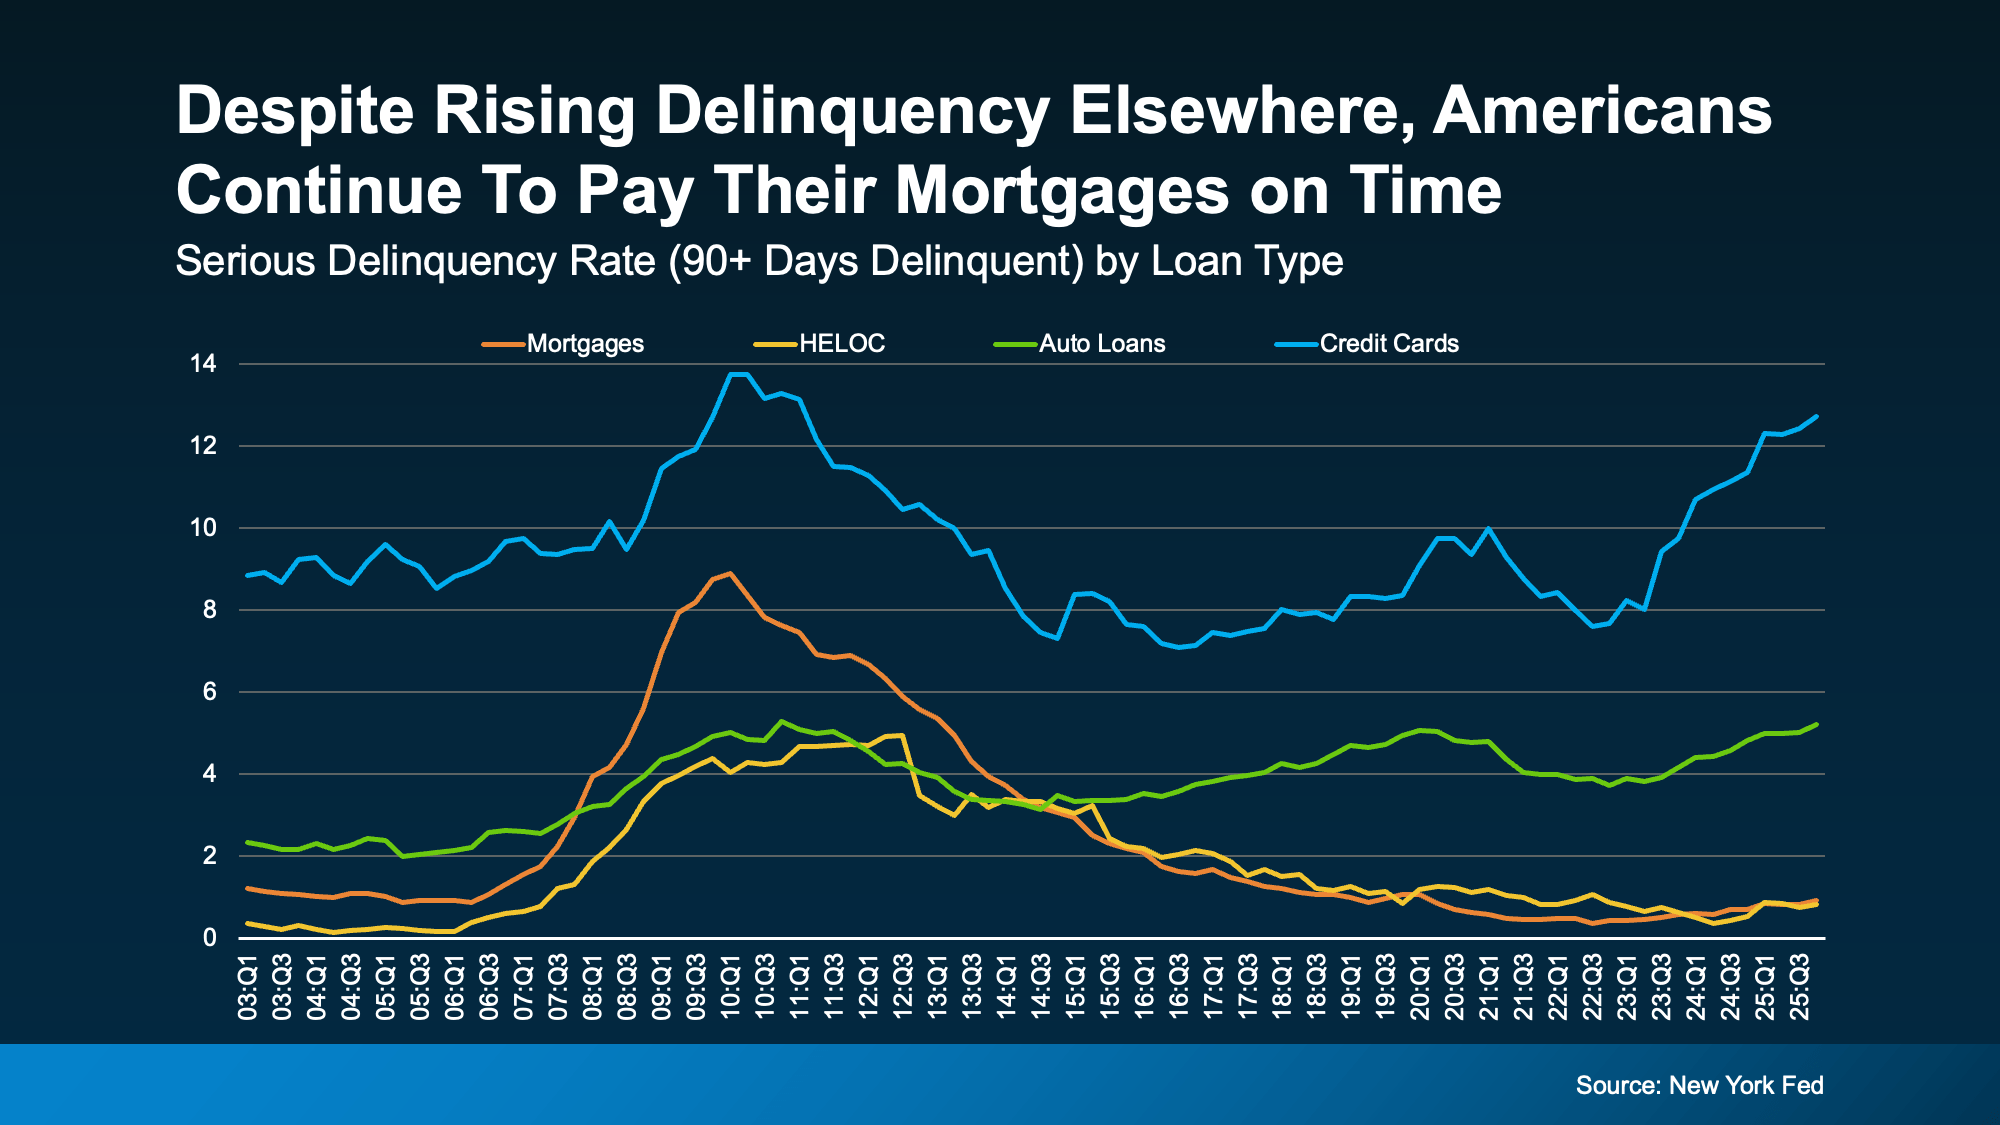 In other words, people may fall behind on other debts, but they fight hard to keep their homes. And, in today’s housing market, they’re also in a strong equity position to do so.
Home Equity Changes Everything
Many people have built significant equity over the past several years. And that creates options. As Daren Blomquist, VP of Market Economics at Auction.com, explains:
“Distressed homeowners… many times they still have equity in their homes. There’s an opportunity for them to sell that home, avoid foreclosure, and walk away with equity.”
That’s a major difference from 2008. Back then, many homeowners owed more than their homes were worth. And selling wasn’t an easy solution. Today, for many people, it is. And even in situations where equity isn’t enough, homeowners are encouraged to contact their loan servicer early to explore alternatives to foreclosure.
Bottom Line
Are foreclosure filings rising slightly? Yes. Are they anywhere near crash territory? No. And homeowners today have far more equity and flexibility than they did during the crash.
If you’re concerned about what you’re seeing in the headlines, the best move isn’t panic, it’s perspective. And the data right now says this isn’t 2008 all over again.


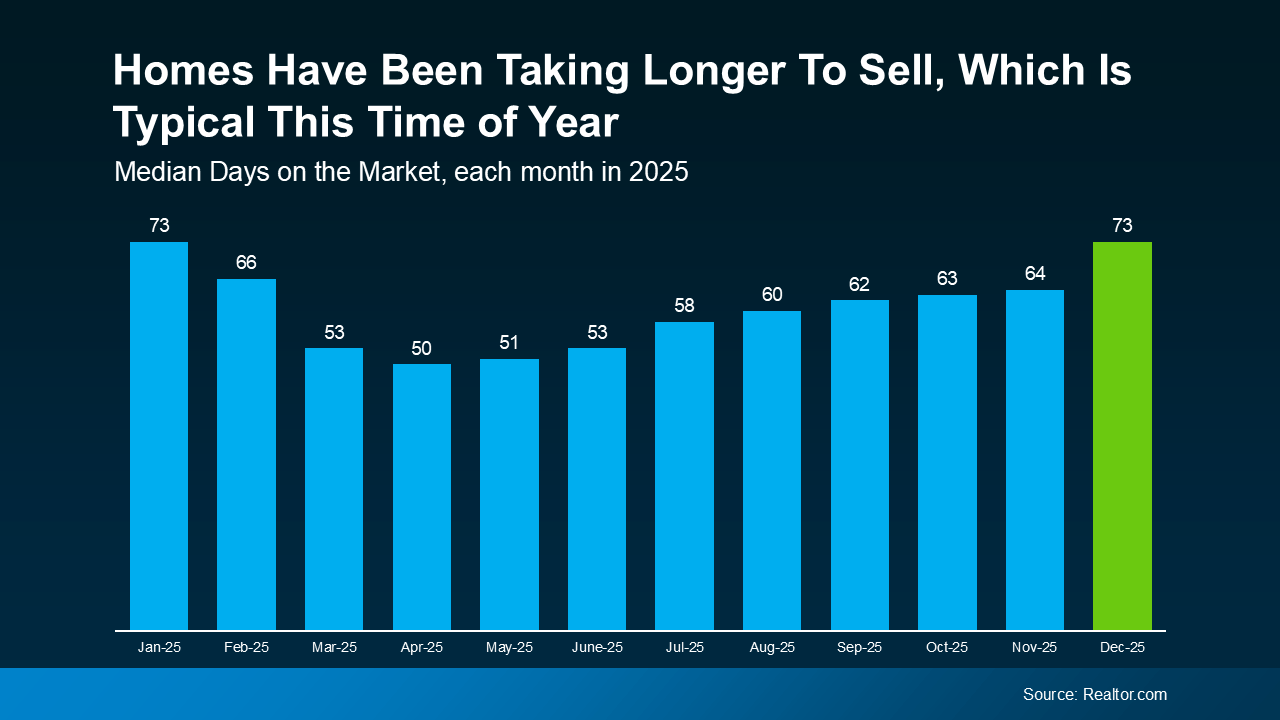
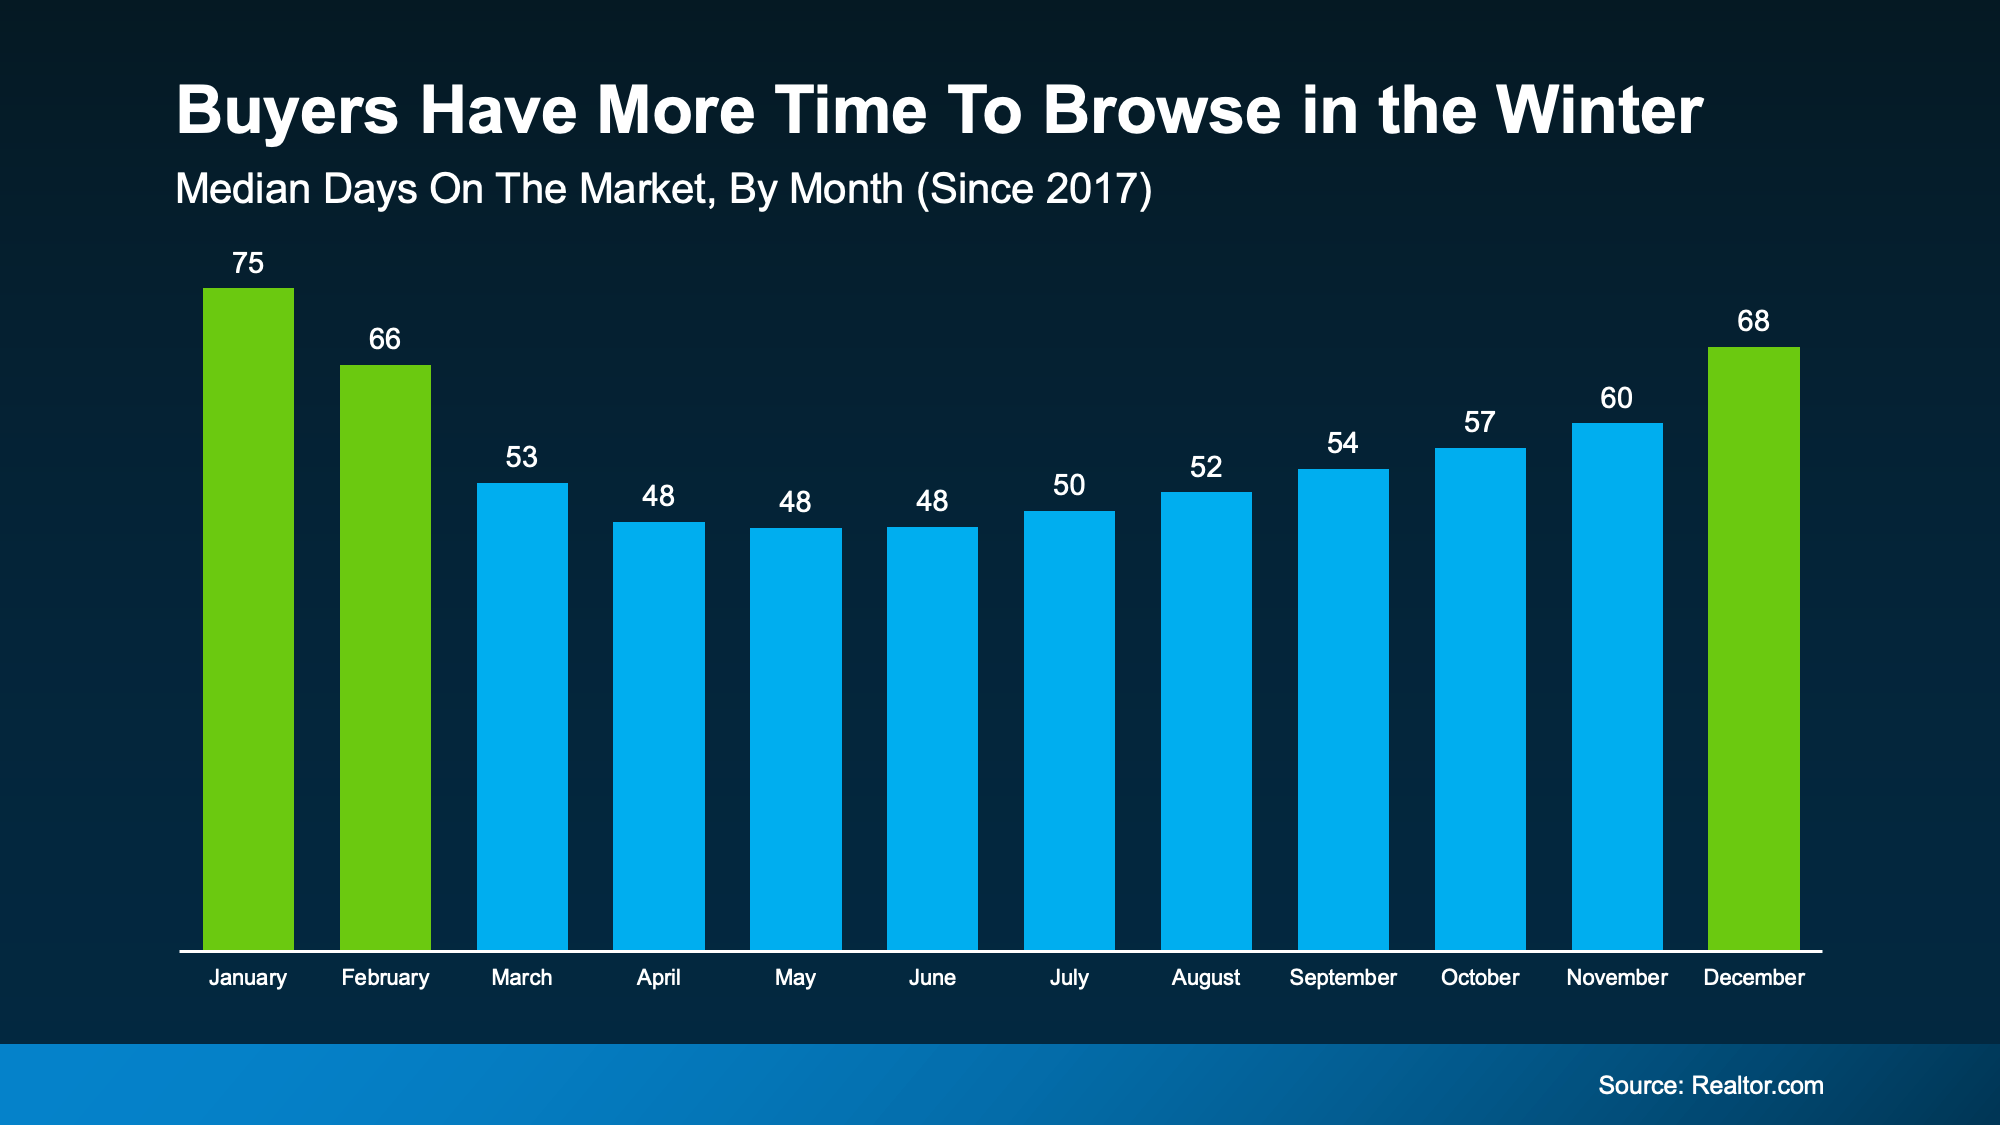 Homes sell faster in the spring, and slower in the winter. And that can be a worthwhile perk for buyers who want to get ahead before their decisions start to feel rushed.


 So, What Can You Do About It?