Category Archives: Pricing

Auto Added by WPeMatico

The 2020 Real Estate Projections That May Surprise You

The 2020 Real Estate Projections That May Surprise You | Simplifying The Market

This will be an interesting year for residential real estate. With a presidential election taking place this fall and talk of a possible recession occurring before the end of the year, predicting what will happen in the 2020 U.S. housing market can be challenging. As a result, taking a look at the combined projections from the most trusted entities in the industry when it comes to mortgage rates, home sales, and home prices is incredibly valuable – and they may surprise you.

Mortgage Rates

Projections from the experts at the National Association of Realtors (NAR), the Mortgage Bankers Association (MBA), Fannie Mae, and Freddie Mac all forecast mortgage rates remaining stable throughout 2020:The 2020 Real Estate Projections That May Surprise You | Simplifying The Market
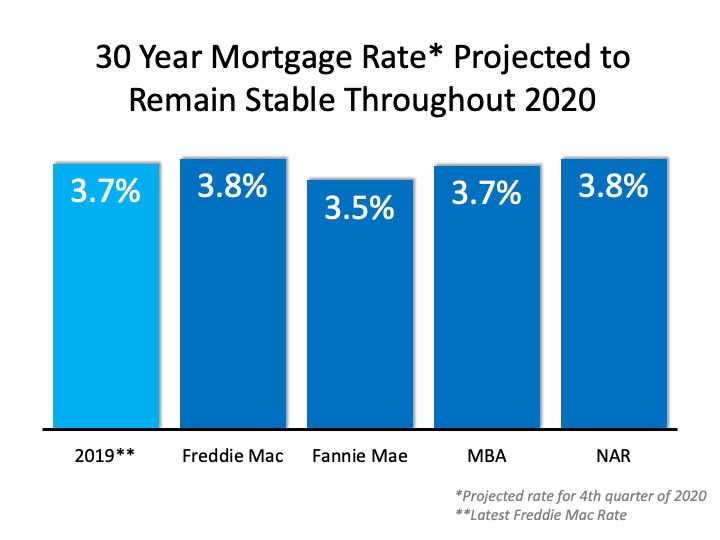
Since rates have remained under 5% for the last decade, we may not fully realize the opportunity we have right now.

Here are the average mortgage interest rates over the last several decades:

  • 1970s: 8.86%
  • 1980s: 12.70%
  • 1990s: 8.12%
  • 2000s: 6.29%

Home Sales

Three of the four expert groups noted above also predict an increase in home sales in 2020, and the fourth sees the transaction number remaining stable:The 2020 Real Estate Projections That May Surprise You | Simplifying The Market

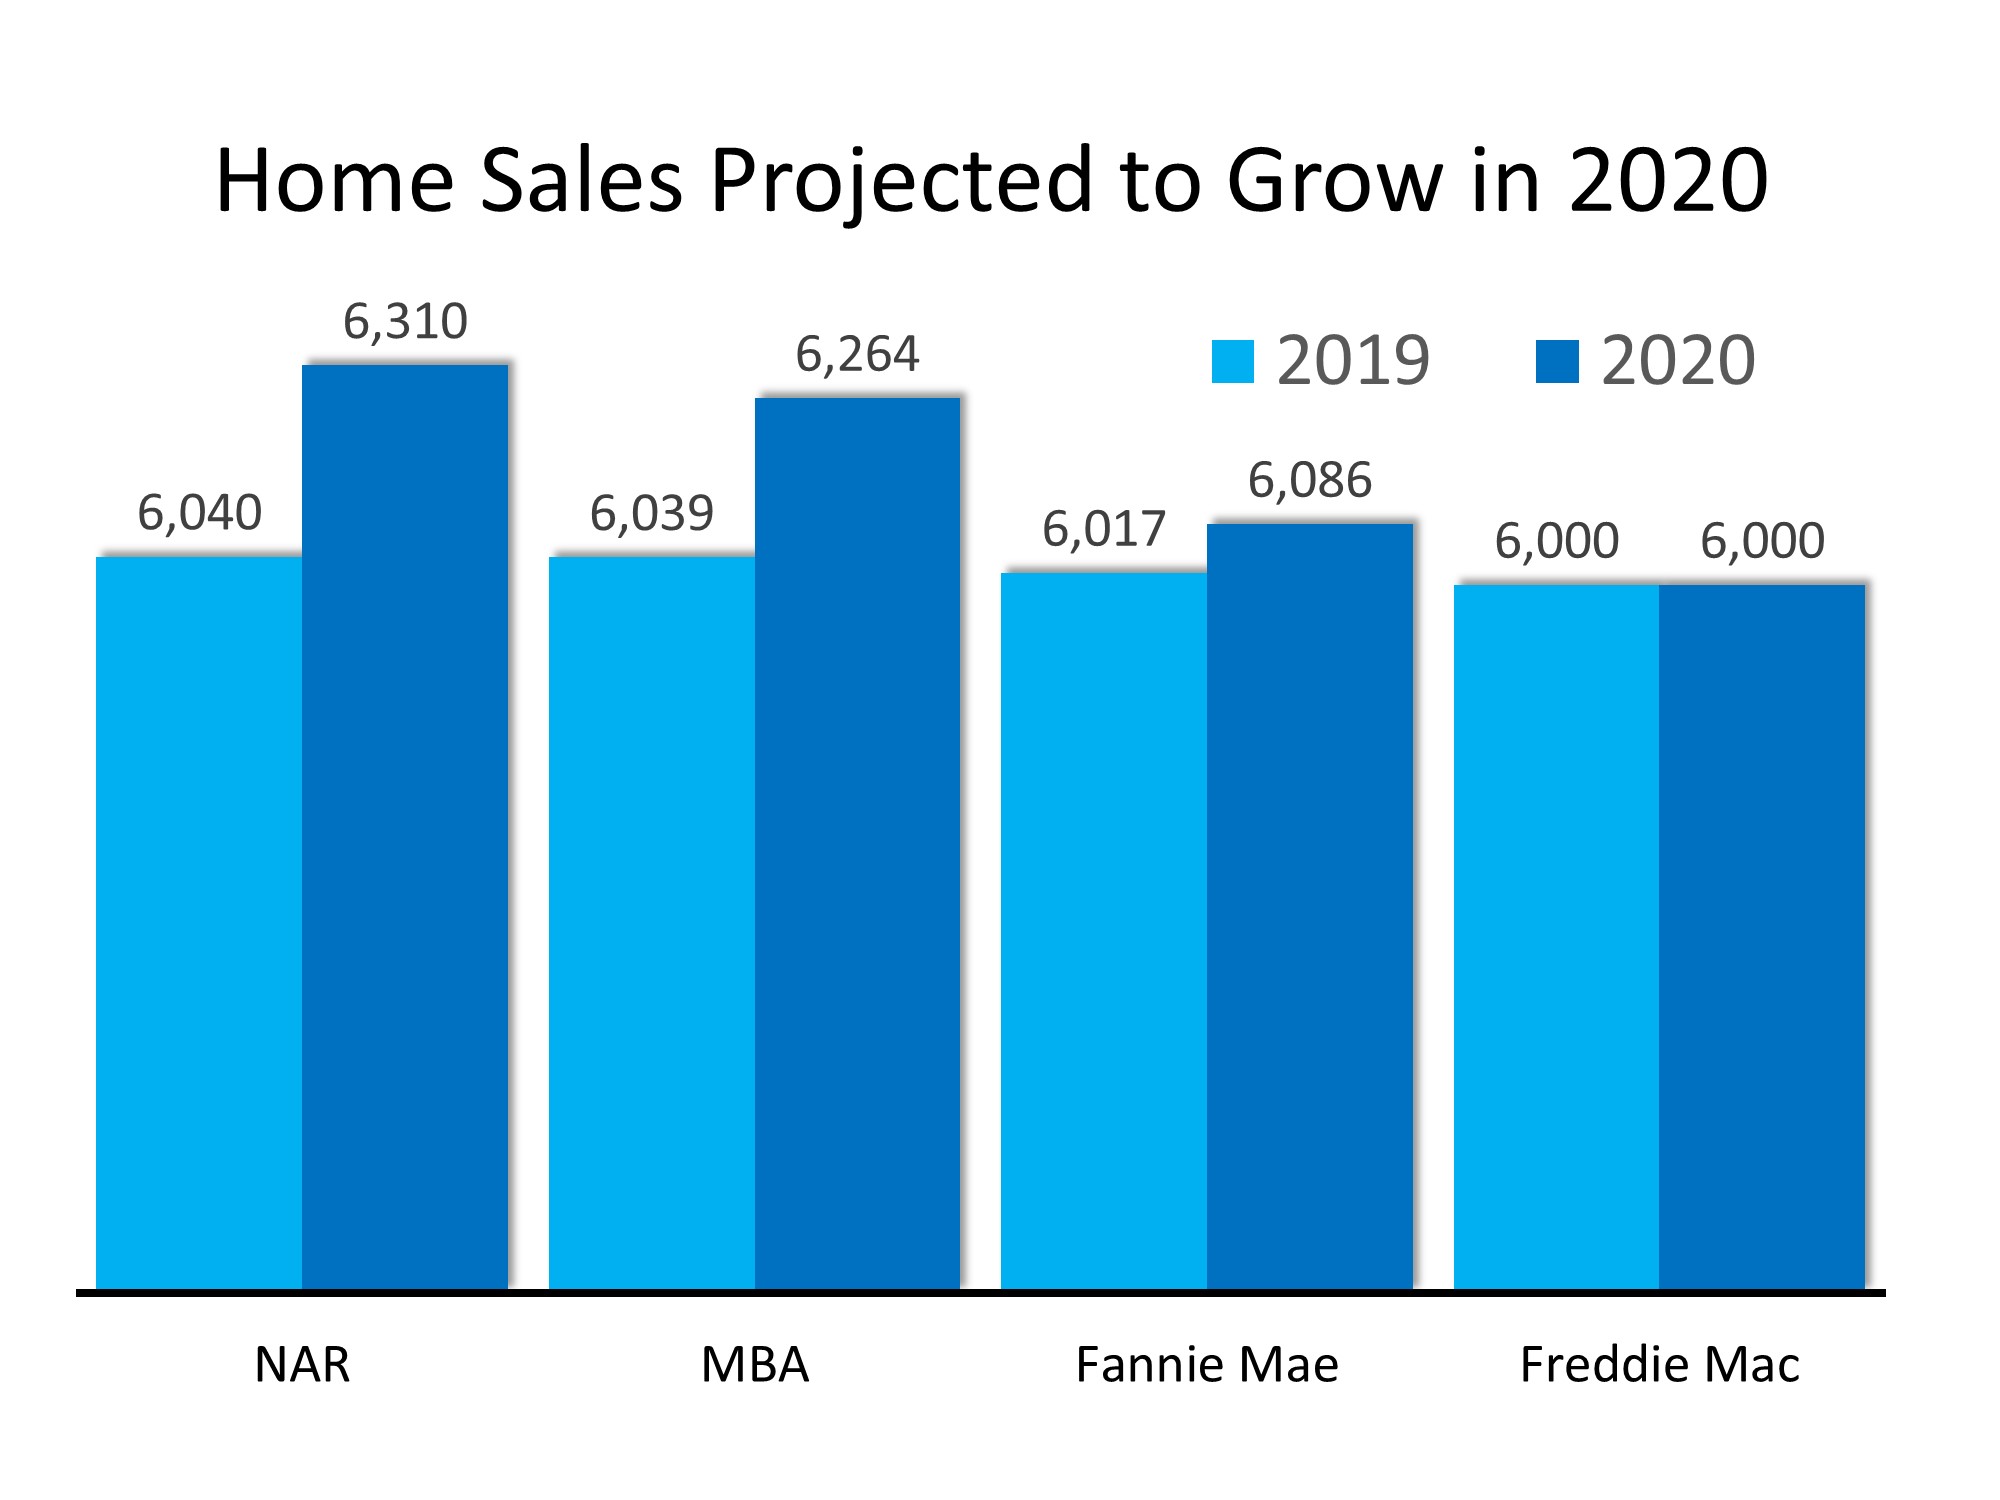
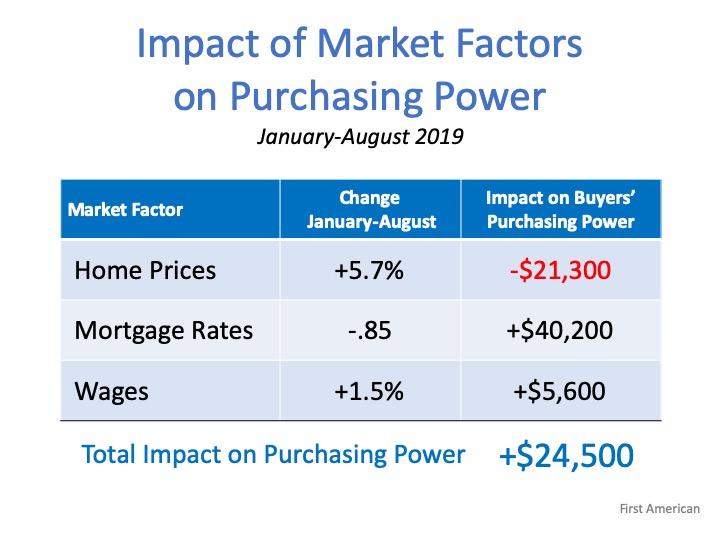
With mortgage rates remaining near all-time lows, demand should not be a challenge. The lack of available inventory, however, may moderate the increase in sales.

Home Prices

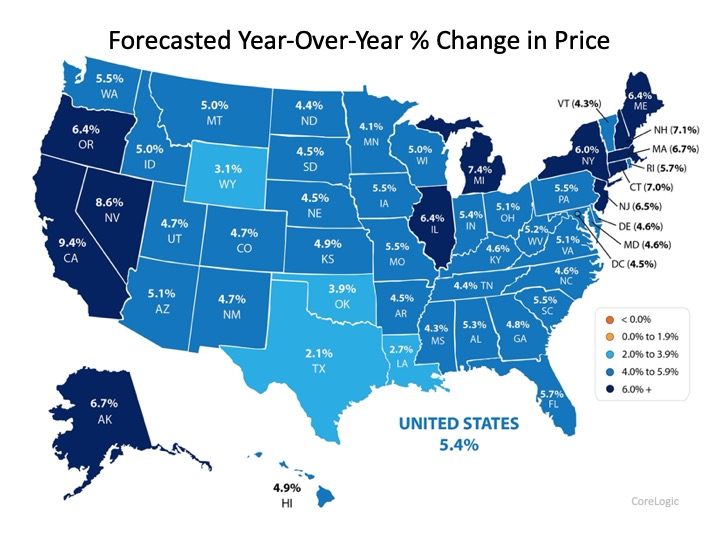
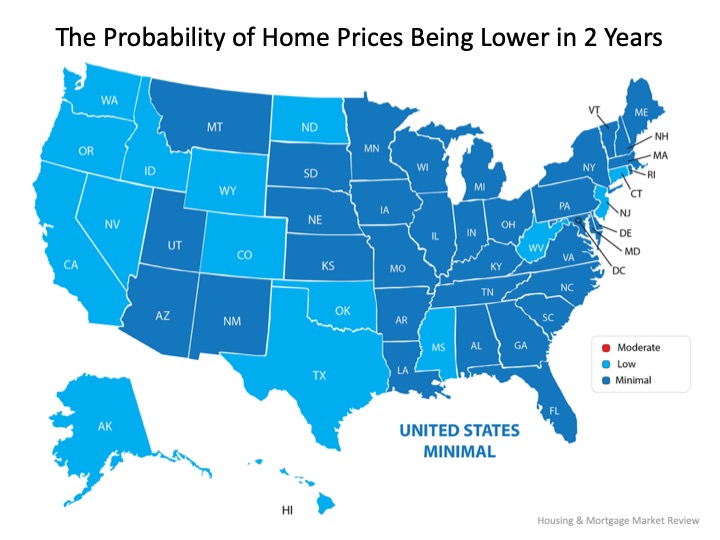
Below are the projections from six different expert entities that look closely at home values: CoreLogic, Fannie Mae, Ivy Zelman’s “Z Report”, the National Association of Realtors (NAR), Freddie Mac, and the Mortgage Bankers Association (MBA).The 2020 Real Estate Projections That May Surprise You | Simplifying The Market
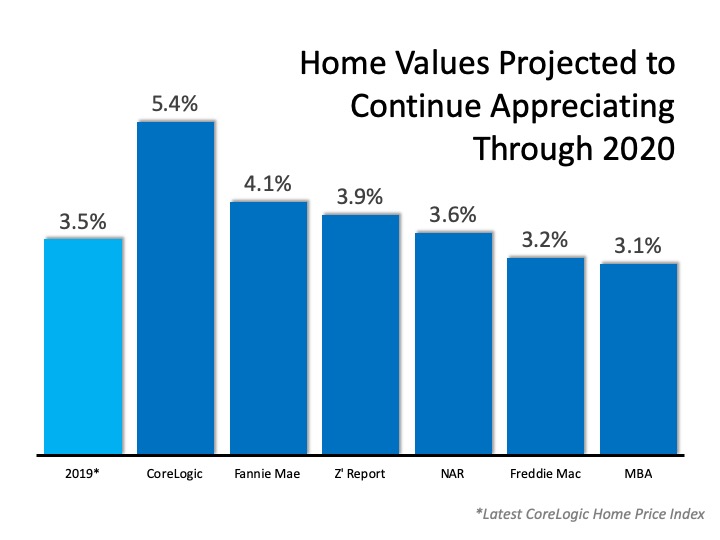
Each group has home values continuing to improve through 2020, with four of them seeing price appreciation increasing at a greater pace than it did in 2019.

Is a Recession Possible?

In early 2019, a large percentage of economists began predicting a recession may occur in 2020. In addition, a recent survey of potential home purchasers showed that over 50% agreed it would occur this year. The economy, however, remained strong in the fourth quarter, and that has caused many to rethink the possibility.

For example, Goldman Sachs, in their 2020 U.S. Outlook, explained:

“Markets sounded the recession alarm this year, and the average forecaster now sees a 33% chance of recession over the next year. In contrast, our new recession model suggests just a 20% probability. Despite the record age of the expansion, the usual late-cycle problems—inflationary overheating and financial imbalances—do not look threatening.”

Bottom Line

Mortgage rates are projected to remain under 4%, causing sales to increase in 2020. With growing demand and a limited supply of inventory, prices will continue to appreciate, while the threat of an impending recession seems to be softening. It looks like 2020 may be a solid year for the real estate market.

2020 Forecast Shows Continued Home Price Appreciation

2020 Forecast Shows Continued Home Price Appreciation | Simplifying The Market

Questions continue to rise around where home prices will head in 2020. The latest forecast from CoreLogic shows continued appreciation at 5.4% over the next year:
2020 Forecast Shows Continued Home Price Appreciation | Simplifying The Market
Additionally, ARCH Mortgage Insurance Company in their current Housing and Mortgage Market Review revealed their latest ARCH Risk Index, which estimates the probability of home prices being lower in two years. Based on the most recent results, 32 of the 50 U.S. states (plus D.C.) had a minimal probability of lowering by 2021.2020 Forecast Shows Continued Home Price Appreciation | Simplifying The Market

Bottom Line

Experts forecast home price appreciation to continue at a moderate rate as we move through 2020 and beyond. With appreciation growing, let’s get together and plan for your next move.

Have You Budgeted for Closing Costs?

Have You Budgeted for Closing Costs? | Simplifying The Market

Saving for a down payment is a key step in the homebuying process, and it’s not the only piece you need to include in your budget. Another factor that’s important to plan for is the closing costs required to obtain a mortgage.

What Are Closing Costs?

According to Trulia,

When you close on a home, a number of fees are due. They typically range from 2% to 5% of the total cost of the home, and can include title insurance, origination fees, underwriting fees, document preparation fees, and more.”

For those who buy a $250,000 home, for example, that amount could be between $5,000 and $12,500 in closing fees. Keep in mind, if you’re in the market for a home above this price range, your costs could be significantly greater. As mentioned before,

Closing costs are typically between 2% and 5% of your purchase price.

 Trulia gives more great advice, saying,

“There will be lots of paperwork in front of you on closing day, and not enough time to read them all. Work closely with your real estate agent, lender, and attorney, if you have one, to get all the documents you need ahead of time.

The most important thing to read is the closing disclosure, which shows your loan terms, final closing costs, and any outstanding fees. You’ll get this form about three days before closing since, once you (the borrower) sign it, there’s a three-day waiting period before you can sign the mortgage loan docs. If you have any questions about the numbers or what any of the mortgage terms mean, this is the time to ask—your real estate agent is a great resource for getting you all the answers you need.”

Bottom Line

Let’s get together to discuss the homebuying process, to be sure your plan includes budgeting for what you need to purchase your dream home – without any surprises!

Forget the Price of the Home. The Cost is What Matters.

Forget the Price of the Home. The Cost is What Matters. | Simplifying The Market

Home buying activity (demand) is up, and the number of available listings (supply) is down. When demand outpaces supply, prices appreciate. That’s why firms are beginning to increase their projections for home price appreciation going forward. As an example, CoreLogic increased their 12-month projection for home values from 4.5% to 5.6% over the last few months.

The reacceleration of home values will cause some to again voice concerns about affordability. Just last week, however, First American came out with a data analysis that explains how price is not the only market factor that impacts affordability. They studied prices, mortgage rates, and wages from January through August of this year. Here are their findings:

Home Prices

“In January 2019, a family with the median household income in the U.S. could afford to buy a $373,900 house. By August, that home had appreciated to $395,000, an increase of $21,100.”

Mortgage Interest Rates

“The 0.85 percentage point drop in mortgage rates from January 2019 through August 2019 increased affordability by 9.7%. That translates to a $40,200 improvement in house-buying power in just eight months.”

Wage Growth

“As rates have fallen in 2019, the economy has continued to perform well also, resulting in a tight labor market and wage growth. Wage growth pushes household incomes upward, which were 1.5% higher in August compared with January. The growth in household income increased consumer house-buying power by 1.5%, pushing house-buying power up an additional $5,600.”

When all three market factors are combined, purchasing power increased by $24,500, thus making home buying more affordable, not less affordable. Here is a table that simply shows the data:Forget the Price of the Home. The Cost is What Matters. | Simplifying The Market

Bottom Line

In the article, Mark Fleming, Chief Economist at First American, explained it best:

“Focusing on nominal house price changes alone as an indication of changing affordability, or even the relationship between nominal house price growth and income growth, overlooks what matters more to potential buyers – surging house-buying power driven by the dynamic duo of mortgage rates and income growth. And, we all know from experience, you buy what you can afford to pay per month.”

How to Determine If You Can Afford to Buy a Home

The gap between the increase in personal income and residential real estate prices has been used to defend the concept that we are experiencing an affordability crisis in housing today.

It is true that home prices and wages are two key elements in any affordability equation. There is, however, an extremely important third component to that equation: mortgage interest rates.

Mortgage interest rates have fallen by more than a full percentage point from this time last year. Today’s rate is 3.75%; it was 4.86% at this time last year. This has dramatically increased a purchaser’s ability to afford a home.

Here are three reports validating that purchasing a home is in fact more affordable today than it was a year ago:

CoreLogic’s Typical Mortgage Payment

“Falling mortgage rates and slower home-price growth mean that many buyers this year are committing to lower mortgage payments than they would have faced for the same home last year. After rising at a double-digit annual pace in 2018, the principal-and-interest payment on the nation’s median-priced home – what we call the “typical mortgage payment”– fell year-over-year again.”  

The National Association of Realtors’ Affordability Index

“At the national level, housing affordability is up from last month and up from a year ago…All four regions saw an increase in affordability from a year ago…Payment as a percentage of income was down from a year ago.”

First American’s Real House Price Index (RHPI)

“In 2019, the dynamic duo of lower mortgage rates and rising incomes overcame the negative impact of rising house price appreciation on affordability. Indeed, affordability reached its highest point since January 2018. Focusing on nominal house price changes alone as an indication of changing affordability, or even the relationship between nominal house price growth and income growth, overlooks what matters more to potential buyers – surging house-buying power driven by the dynamic duo of mortgage rates and income growth. And, we all know from experience, you buy what you can afford to pay per month.”

Bottom Line

Though the price of homes may still be rising, the cost of purchasing a home is actually falling. If you’re thinking of buying your first home or moving up to your dream home, let’s connect so you can better understand the difference between the two.

Think Prices Have Skyrocketed? Look at Rents.

Think Prices Have Skyrocketed? Look at Rents. | Simplifying The Market

Much has been written about how residential real estate values have increased since the housing market started its recovery in 2012. However, little has been shared about what has taken place with residential rental prices. Let’s shed a little light on this subject.

In the most recent Apartment Rent Report, RentCafe explains how rents have continued to increase over the last twelve months because of a large demand and a limited supply.

 “Continued interest in rental apartments and slowing construction keeps the national average rent on a strong upward trend.”

Zillow, in its latest Rent Index, agreed that rents are continuing on an “upward trend” across most of the country, and that the trend is accelerating:

“The median U.S. rent grew 2% year-over-year, to $1,595 per month. National rent growth is faster than a year ago, and while 46 of the 50 largest markets are showing deceleration in annual home value growth, annual rent growth is accelerating in 41 of the largest 50 markets.”

The Zillow report went on to detail rent increases since the beginning of the housing market recovery in 2012. Here is a graph showing the increases:Think Prices Have Skyrocketed? Look at Rents. | Simplifying The Market

Bottom Line

It is true that home prices have risen over the past seven years, increasing the cost of owning a home. However, the cost of renting a home has also increased over that same time period.

Depending on the Price, You’re Going to Need Advice

Depending on the Price, You’re Going to Need Advice | Simplifying The Market

To understand today’s complex real estate market, it is critical to have a local, trusted advisor on your side – for more reasons than you may think.

In real estate today, there are essentially three different price points in the market: the starter-home market, the middle-home market, and the premium or luxury market. Each one is unique, and depending on the city, the price point in these categories will vary. For example, a starter or lower-end home in San Francisco, California is much more expensive than almost any other part of the country. Let’s explore what you need to know about each of these tiers.

Starter-Home Market: This market varies by price, and these homes are typically purchased by first-time home buyers or investors looking to flip them for a profit. Across the country, homes in this space currently have less than 6 months of inventory for sale. That means there aren’t enough homes on the lower end of the market for the number of people who want to buy them. A low supply like this generally increases competition, drives bidding wars, and sets up an environment where homes sell above the listing price. According to data from the National Association of Realtors (NAR) on realtor.com,

“The desire for affordability continues to push down the inventory for homes listed for less than $200,000.00.”

Middle-Home Market: This segment is often thought of as the move-up market. Typically, the buyer in this market is moving up to a larger, more custom home with more features, all coming at a higher price. Across the country, this market is looking more balanced than the lower end of the market, meaning it has closer to a 6-month supply of inventory for sale. This market is more neutral, but leaning towards a seller’s market.

Premium & Luxury Home Market: This is the top end of the market with larger homes that have even more custom features and upgrades. Nationwide, this market is growing in the number of homes for sale. In the same realtor.com article, we can see that year-over-year inventory of homes in this tier has grown by 4.7%. Today, there are more homes available in the premium and luxury space, leading to more of a buyer’s market at this end.

Bottom Line

Depending on the segment of the market and the price point you’re looking at, you’re going to need the advice of a true local market expert. Let’s get together to help you navigate the home-buying or selling process in your market.

3 Signs the Housing Market Is on the Rebound

3 Signs the Housing Market Is on the Rebound | Simplifying The Market

The residential real estate market has been plodding along for most of the year. However, three recent reports show the market may be on the verge of a rebound.

1. Existing Home Sales (closed sales) are up, marking two consecutive months of growth.

2. Pending Home Sales (contracts signed) are up with each of the four major regions reporting both month-over-month growth and year-over-year gains in contract activity.
Here is the month-over-month growth:

  • The Northeast rose 0.7%
  • The Midwest increased 0.6%
  • The South increased 1.4%
  • The West grew 3.1%

3. Buyer Traffic (the number of people shopping for a home) is up compared to the same time last year, and for the first time in 13 months.

  • The Northeast is up 5.9%
  • The Midwest increased 1.3%
  • The South is up 2.7%
  • The West grew 2.2%

In their most recent report, ShowingTime Chief Analytics Officer, Daniil Cherkasskiy explained:

“The trend we saw in year-over-year buyer traffic in previous months continued across the United States. For all four regions there were more showings per listing this year compared to last year, making it the most competitive August in the last five years.”

Lawrence Yun, Chief Economist with the National Association of Realtors, believes the uptick in activity will continue into the future:

“It is very encouraging that buyers are responding to exceptionally low interest rates…With interest rates expected to remain low, home sales are forecasted to rise in the coming months and into 2020.”

Bottom Line

If you are thinking about selling your house, there are purchasers out there who are ready, willing, and able to buy.

Are You Ready for the ‘Black Friday’ of Real Estate?

Are You Ready for the ‘Black Friday’ of Real Estate? | Simplifying The Market

According to a new study from realtor.com, the week of September 22 is the best time of year to buy a home, making it ‘Black Friday’ for homebuyers.

Every year, ‘Black Friday’ is a highly anticipated event for eager shoppers. Some people prepare for weeks, crafting and refining a strategic shopping agenda, determining exactly when to arrive at each store, and capturing a wish list of discounted must-have items to purchase. But what about buying a home? Is there a ‘Black Friday’ for the home-buying process? Believe it or not, there is.

According to a new study from realtor.com, the week of September 22 is the best time of year to buy a home, making it ‘Black Friday’ for homebuyers.

After evaluating housing data in 53 metros from 2016 to 2018, realtor.com determined that the first week of fall is when buyers “tend to find less competition, more inventory, and the biggest reductions on list price.

The report explains,

“During the first week of fall, buyers tend to face 26% less competition from other buyers, and they are likely to see 6.1% more homes available on the market compared to other weeks of the year…nearly 6% of homes on the market will also see price reductions, averaging 2.4% less than their peak.”

What’s so different about the first week of fall?

George Ratiu, Senior Economist with realtor.com says,

“As summer winds down and kids return to school, many families hit pause on their home search and wait until the next season to start again…as seasonal inventory builds up and restores itself to more buyer-friendly levels, fall buyers will be in a better position to take advantage of today’s low mortgage rates and increased purchasing power.”

Learn more about how prices, listings, and buyer competition stack up during the first week of fall in your metro area.

Bottom Line

If you want to take advantage of the ‘Black Friday’ of home buying, let’s get together to discuss the benefits of making your next move this fall.

Is Your House “Priced to Sell Immediately”?

Is Your House “Priced to Sell Immediately”? | Simplifying The Market

In today’s real estate market, more houses are coming to market every day. Eager buyers are searching for their dream homes, so setting the right price for your house is one of the most important things you can do.

According to CoreLogic’s latest Home Price Index, home values have risen at over 6% a year over the past two years, but have started to slow to 3.6% over the last 12 months. By this time next year, CoreLogic predicts home values will be 5.4% higher.

With prices slowing from their previous pace, homeowners must realize that pricing their homes a little over market value to leave room for negotiation will actually dramatically decrease the number of buyers who will see their listing (see the chart below).Is Your House “Priced to Sell Immediately”? | Simplifying The MarketInstead of the seller trying to ‘win’ the negotiation with one buyer, they should price their house so demand for the home is maximized. By doing so, the seller will not be negotiating with a buyer over the price, but will instead have multiple buyers competing with each other over the house.

The secret is making sure your house is Priced To Sell Immediately (PTSI). That way, your home will be seen by the most potential buyers. It will sell at a great price before more competition comes to the market.

Bottom Line

If you’re debating listing your house for sale, let’s get together to discuss how to price your home appropriately and maximize your exposure.