Category Archives: Move-Up Buyers

Auto Added by WPeMatico

Homes More Affordable Today than 1985-2000

Homes More Affordable Today than 1985-2000 | Simplifying The Market

Rising home prices have many concerned that the average family will no longer be able to afford the most precious piece of the American Dream – their own home.

However, it is not just the price of a home that determines its affordability. The monthly cost of a home is determined by the price and the interest rate on the mortgage used to purchase it.

Today, mortgage interest rates stand at about 4.5%. The average annual mortgage interest rate from 1985 to 2000 was almost double that number, at 8.92%. When comparing affordability of homeownership over the decades, we must also realize that incomes have increased.

This is why most indexes use the percentage of median income required to make monthly mortgage payments on a typical home as the point of comparison.

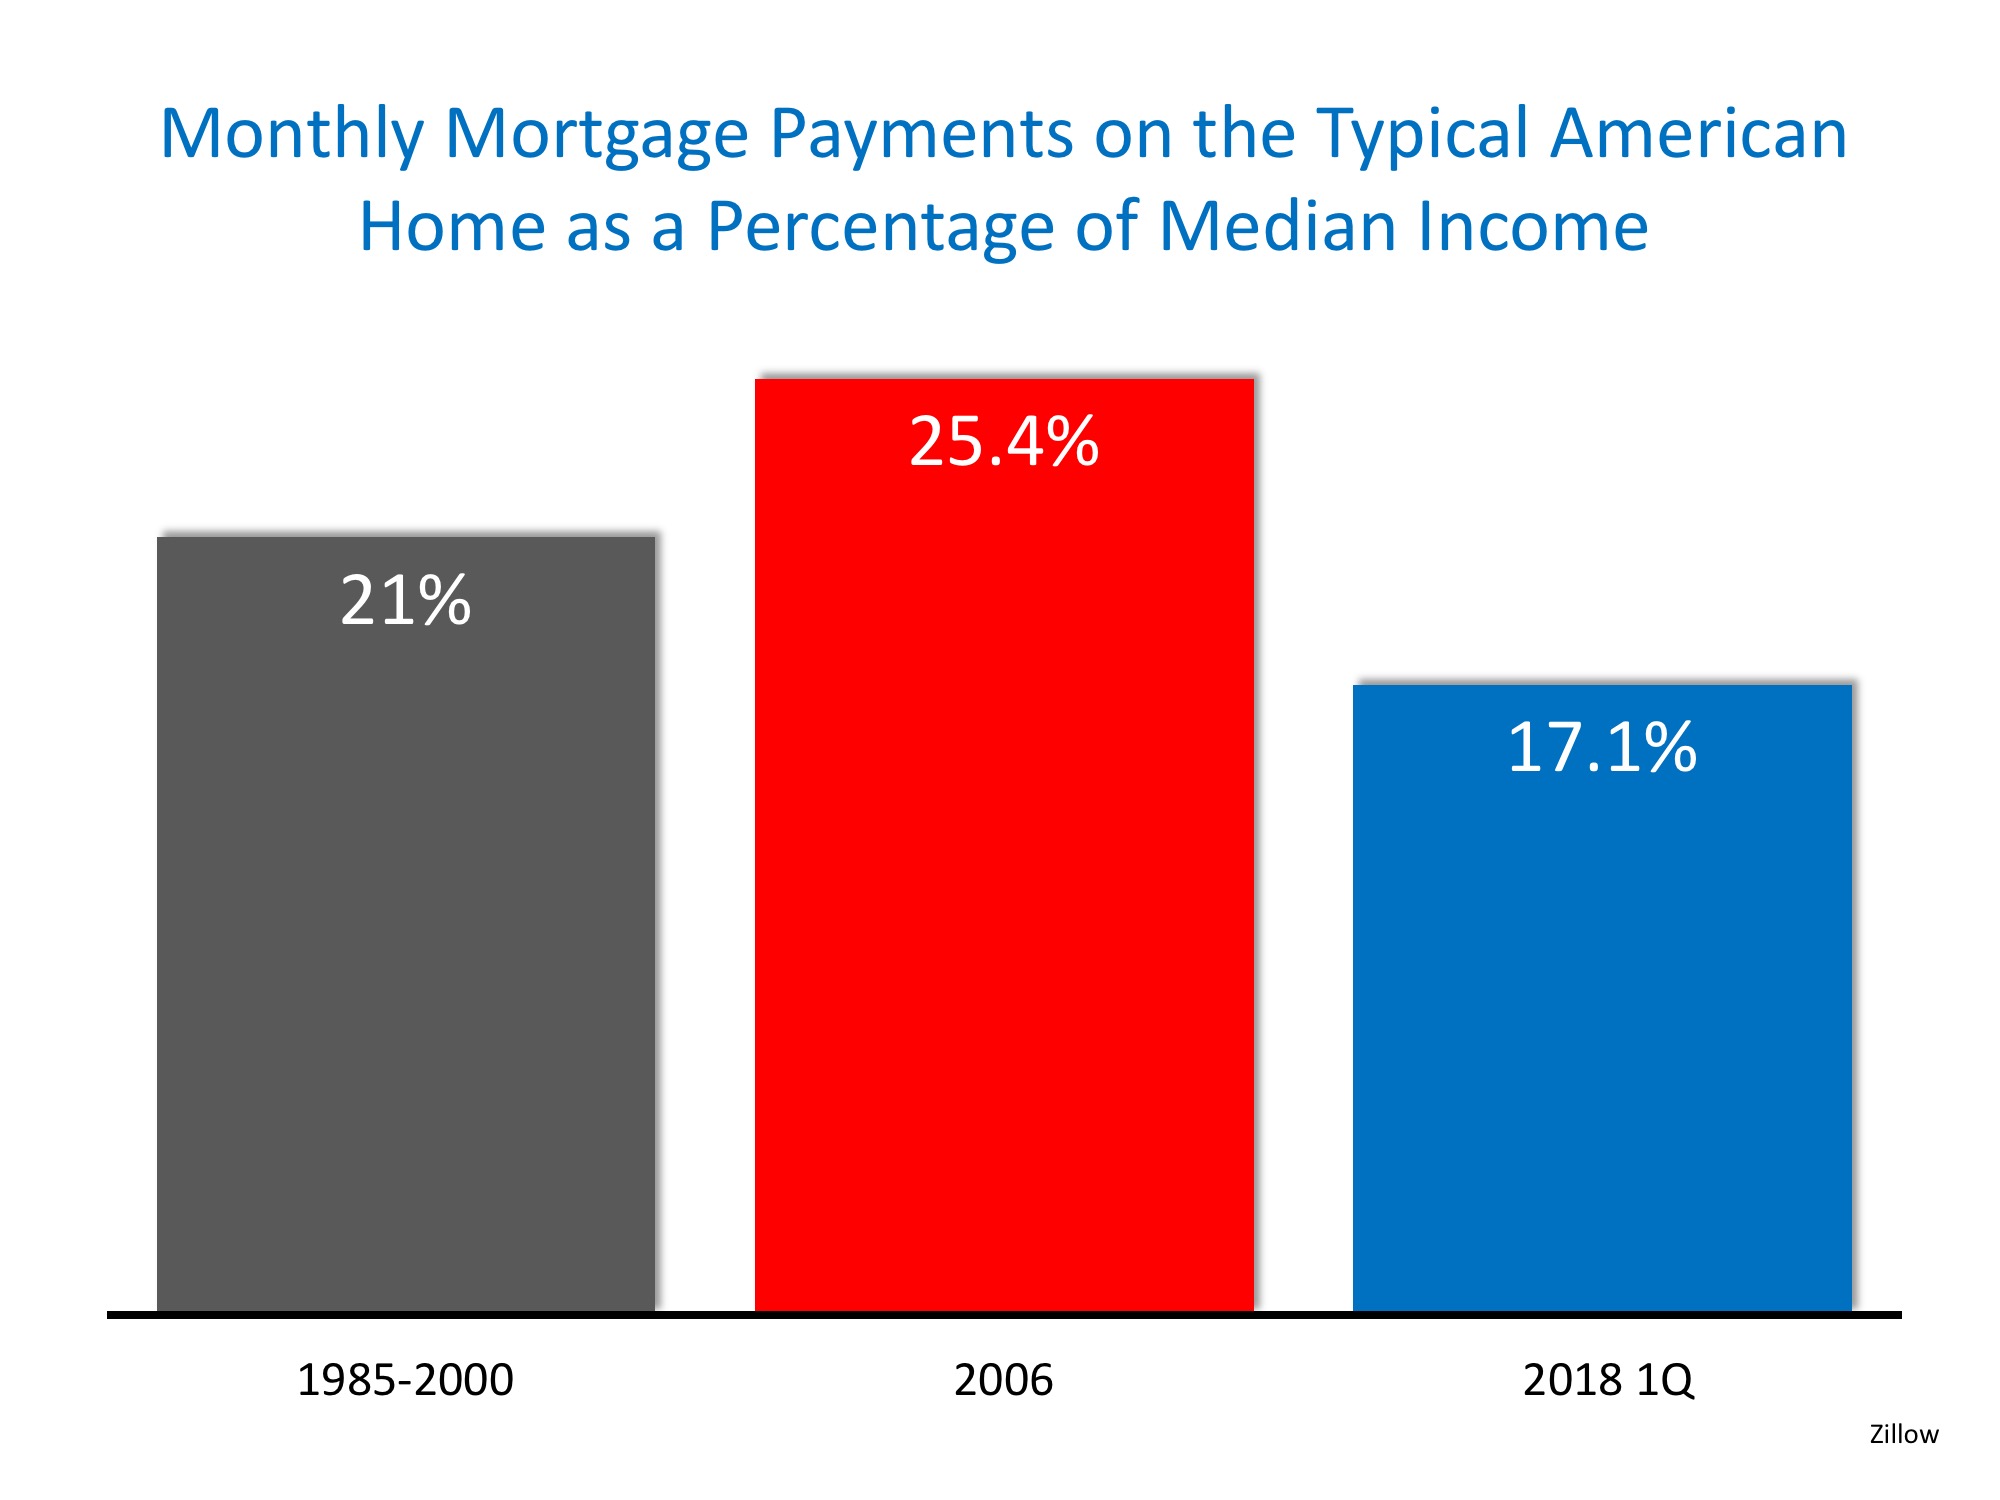
Zillow recently released a report comparing home affordability over the decades using this formula. The report revealed that, though homes are less affordable this year than last year, they are more affordable today (17.1%) than they were between 1985-2000 (21%). Additionally, homes are more affordable now than at the peak of the housing bubble in 2006 (25.4%). Here is a chart of these findings:

Homes More Affordable Today than 1985-2000 | Simplifying The Market

What will happen when mortgage interest rates rise?

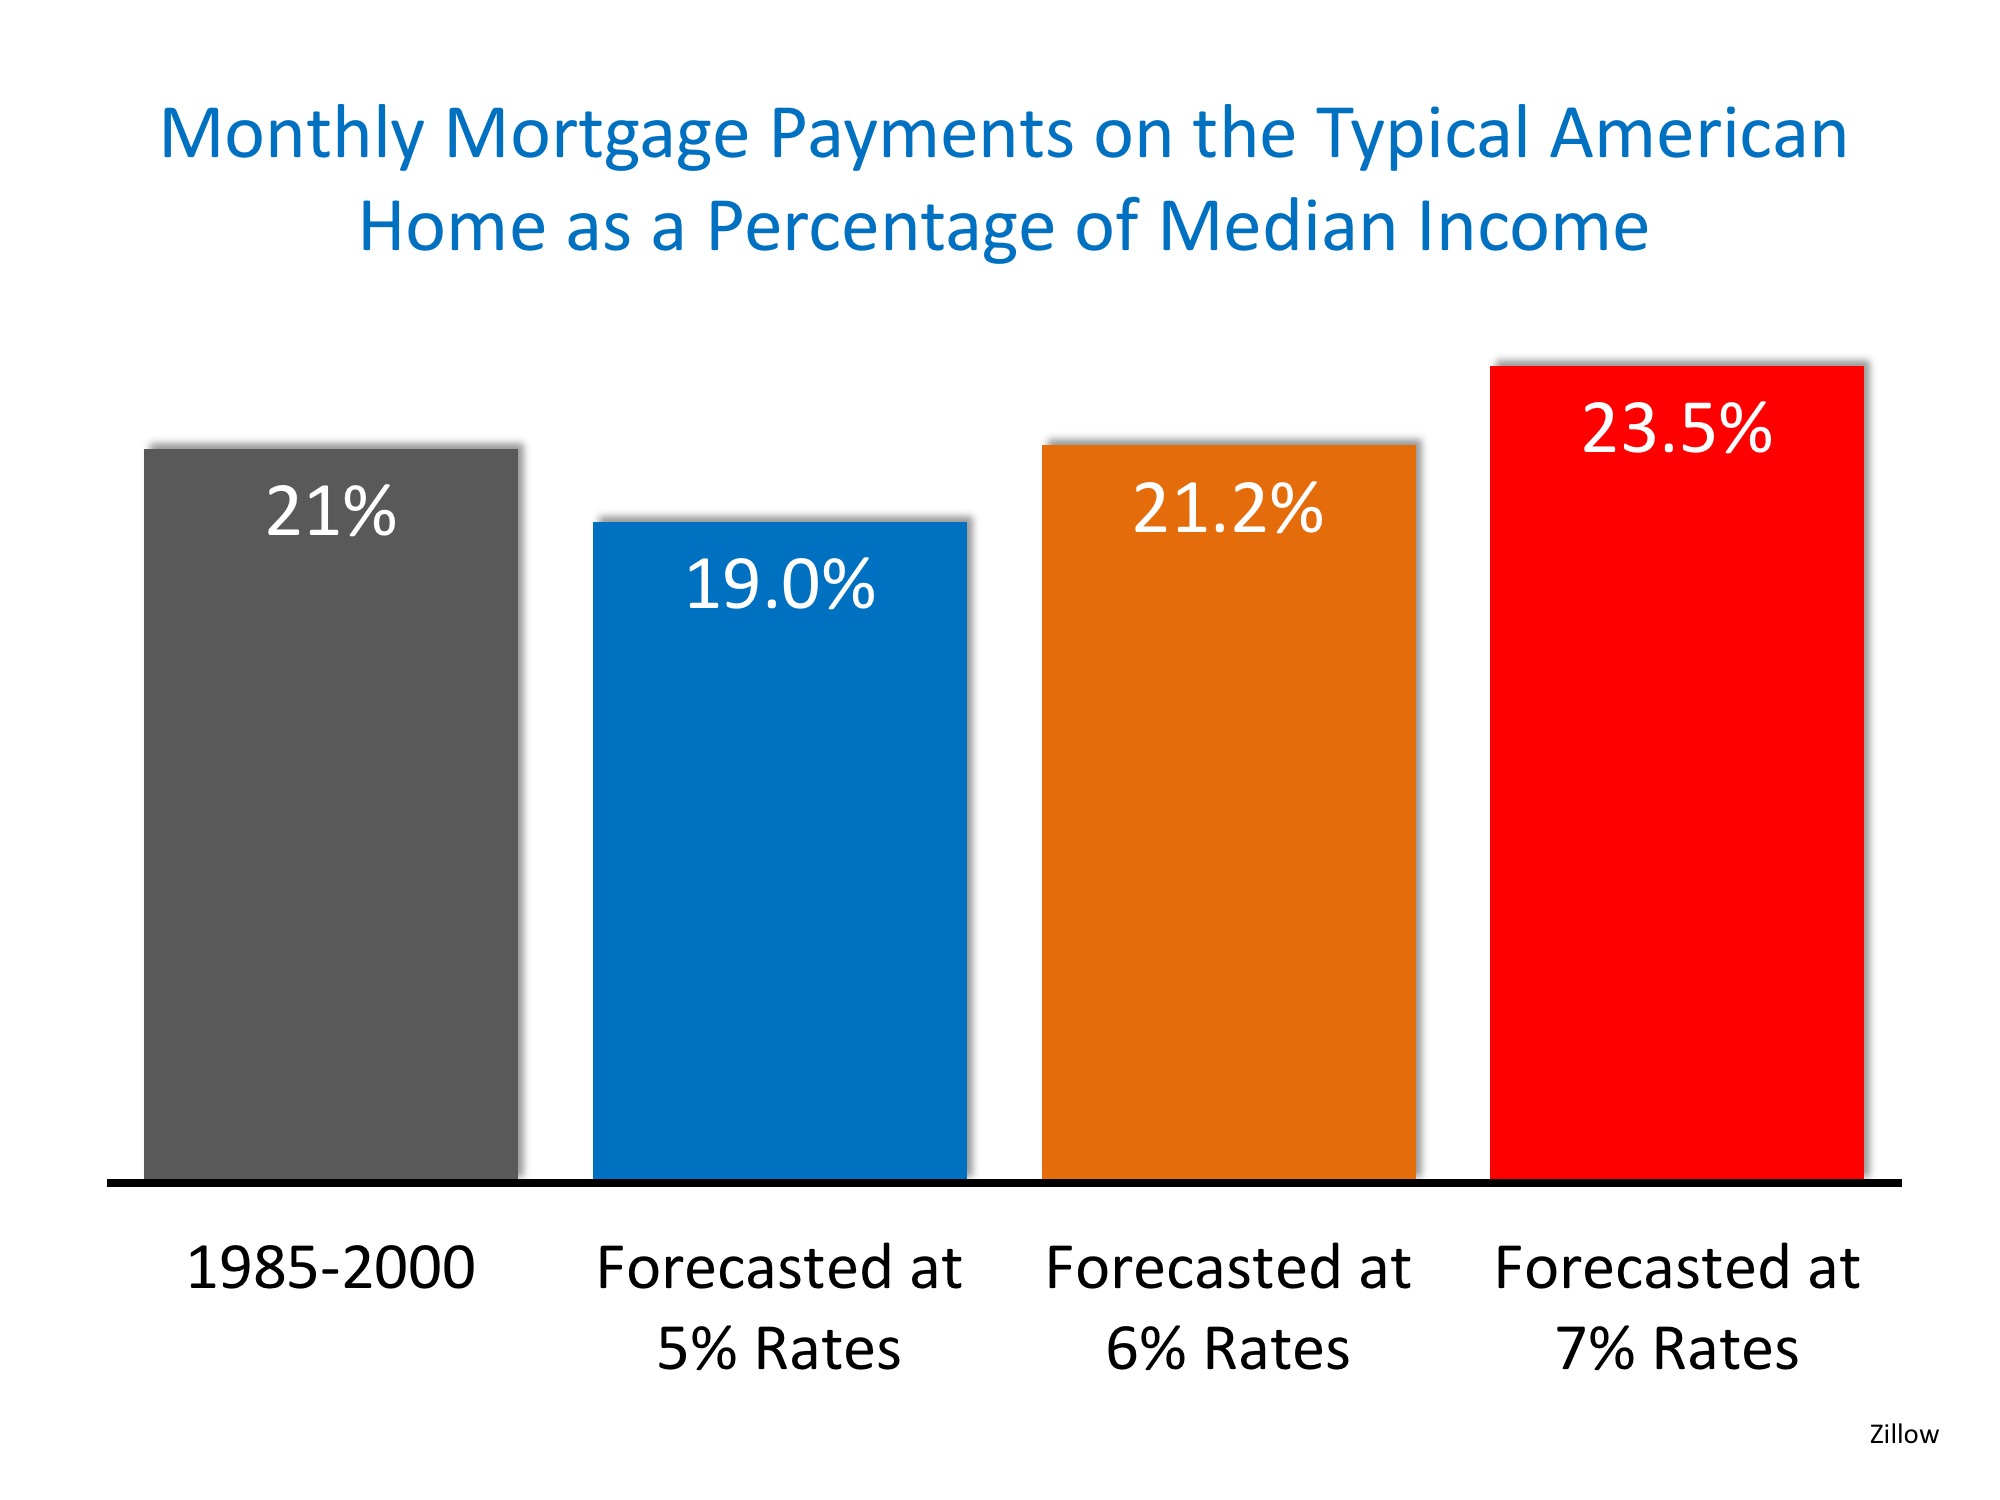
Most experts think that the mortgage interest rate will increase to about 5% by year’s end. How will that impact affordability? Zillow also covered this in their report:

Homes More Affordable Today than 1985-2000 | Simplifying The Market

Rates would need to approach 6% before homes became less affordable than they had been historically.

Bottom Line

Though homes are less affordable today than they were last year, they are still a great purchase while interest rates are below the 6% mark.

VA Loans: Making a Home for the Brave Possible

VA Loans: Making a Home for the Brave Possible | Simplifying The Market

Since the creation of the Veterans Affairs (VA) Home Loans Program, over 22 million veterans have achieved the American Dream of homeownership. Many veterans do not know the details of the program and therefore do not take advantage of the benefits available to them.

If you are a veteran or you know someone who is, here is a breakdown of the VA Home Loan benefits that can be used to achieve the American Dream!

Top 5 Benefits of a VA Home Loan

  1. The greatest benefit of a VA Loan is that borrowers can buy a home with a 0% down payment. In 2016, 82% of all VA Loans put down 0%!
  2. Primary Mortgage Insurance (PMI) is not required! (Most other loans with down payments under 20% require PMI, which adds additional costs to your monthly housing expense!)
  3. Credit Score requirements are also lower for VA Home Loans. The average FICO® score of a borrower for an approved VA Loan is 620, compared to 676 (FHA) or 753 (Conventional).
  4. There is also a limitation on a veteran buyer’s closing costs. Sellers can pay all of a buyer’s loan-related closing costs and up to 4% in concessions in some cases.
  5. Even with interest rates rising, VA Loans continue to have the lowest average interest rates of all loan types.

Who Qualifies for a VA Home Loan?

One of the most important first steps when applying for a VA Home Loan is obtaining your Certificate of Eligibility (COE). “The COE verifies to the lender that you are eligible for a VA-backed loan.”

You Can Apply for a VA Loan if You:

  • Serve 90 consecutive days during wartime
  • Serve 181 consecutive days during peacetime
  • Have more than 6 years in the National Guard or Reserves
  • Are the spouse of a service member who has died in the line of duty or as the result of a service-related disability

You Can Use a VA Loan To:

  • Purchase a Home
  • Purchase a Condo
  • Build a Home
  • Refinance an existing home loan
  • Make improvements to a home by installing energy-related features or making energy-efficient improvements

Bottom Line

For more information or to find out if you or a loved one would qualify to use the VA Home Loan Benefit, let’s get together! Thank you for your service!

Why Should You Use A Professional to Sell Your Home?

Why Should You Use A Professional to Sell Your Home? | Simplifying The Market

When homeowners decide to sell their houses, they obviously want to get the best possible price for their home with the least amount of hassles along the way. However, for the vast majority of sellers, the most important result is actually getting their homes sold.

In order to accomplish all three goals, a seller should realize the importance of using a real estate professional. We realize that technology has changed a buyer’s behavior during the home buying process. According to the National Association of Realtors’ 2018 Home Buyer & Seller Generational Trends Report, the first step that “42% of recent buyers took in the home buying process was to look online at properties for sale.”

However, the report also revealed that 94% of buyers who used the internet when searching for homes ultimately purchased their homes through either a real estate agent/broker or from a builder or builder’s agent. Only 2% of buyers purchased their homes directly from a seller whom they didn’t know.

Buyers search for a home online but then depend on an agent to find the home they will buy (52%), to negotiate the terms of the sale (47%) & price (38%), or to help understand the process (60%).

The plethora of information now available has resulted in an increase in the percentage of buyers who reach out to real estate professionals to “connect the dots.” This is obvious, as the percentage of overall buyers who have used agents to buy their homes has steadily increased from 69% in 2001.

Bottom Line

If you are thinking of selling your home, don’t underestimate the role a real estate professional can play in the process.

Buying This Summer? Be Prepared for Bidding Wars

Buying This Summer? Be Prepared for Bidding Wars | Simplifying The Market

Summer is traditionally a busy season for real estate. Buyers come out in force and homeowners list their houses for sale hoping to capitalize on those buyers who are looking to purchase before the new school year. This year will be no different!

Buyers have already been out in force looking for their dream homes and more are on their way. The challenge is that the inventory of homes for sale has not kept up with demand, which has led to A LOT of competition for the homes that are available.

A recent article by the National Association of Realtors touched on the current market conditions:

“Realtors® in areas with strong job markets report that consumer frustration is rising. Home shoppers are increasingly struggling to find an affordable property to buy, and the prevalence of multiple bids is pushing prices further out of reach.”

Realtor.com went on to explain why buyers are flocking to the market in such big numbers:

“A booming economy and stable employment in most parts of the country have created a new generation of eager home buyers – and led to fevered price battles spilling over into some unexpected, smaller markets.”

Javier Vivas, Director of Economic Research for Realtor.com had this to say about competition:

Multiple-offer scenarios are no longer reserved to the usual big, fast-moving markets…demand for homes has spilled outward into secondary, smaller markets, and more buyers are gearing up to face fierce competition in more places around the country.”

Realtor.com looked at the number of homes that were selling above asking price to determine which markets were heating up. Below are the Top 10:

  • Akron, OH
  • Worcester, MA
  • Lexington, KY
  • Irvine, CA
  • Greensboro, NC
  • Sioux Falls, SD
  • Madison, WI
  • Louisville, KY
  • Tacoma, WA
  • Little Rock, AR

Bottom Line

Let’s get together to discuss our exact market conditions so that we can help you create a strategy to secure your new home in this competitive atmosphere!

What’s the Median Home Value in Your State?

What’s the Median Home Value in Your State? | Simplifying The Market

If you’ve entered the real estate market as a buyer or a seller, you’ve inevitably heard the mantra “location, location, location” in reference to identical homes increasing or decreasing in value based on where they’re located.

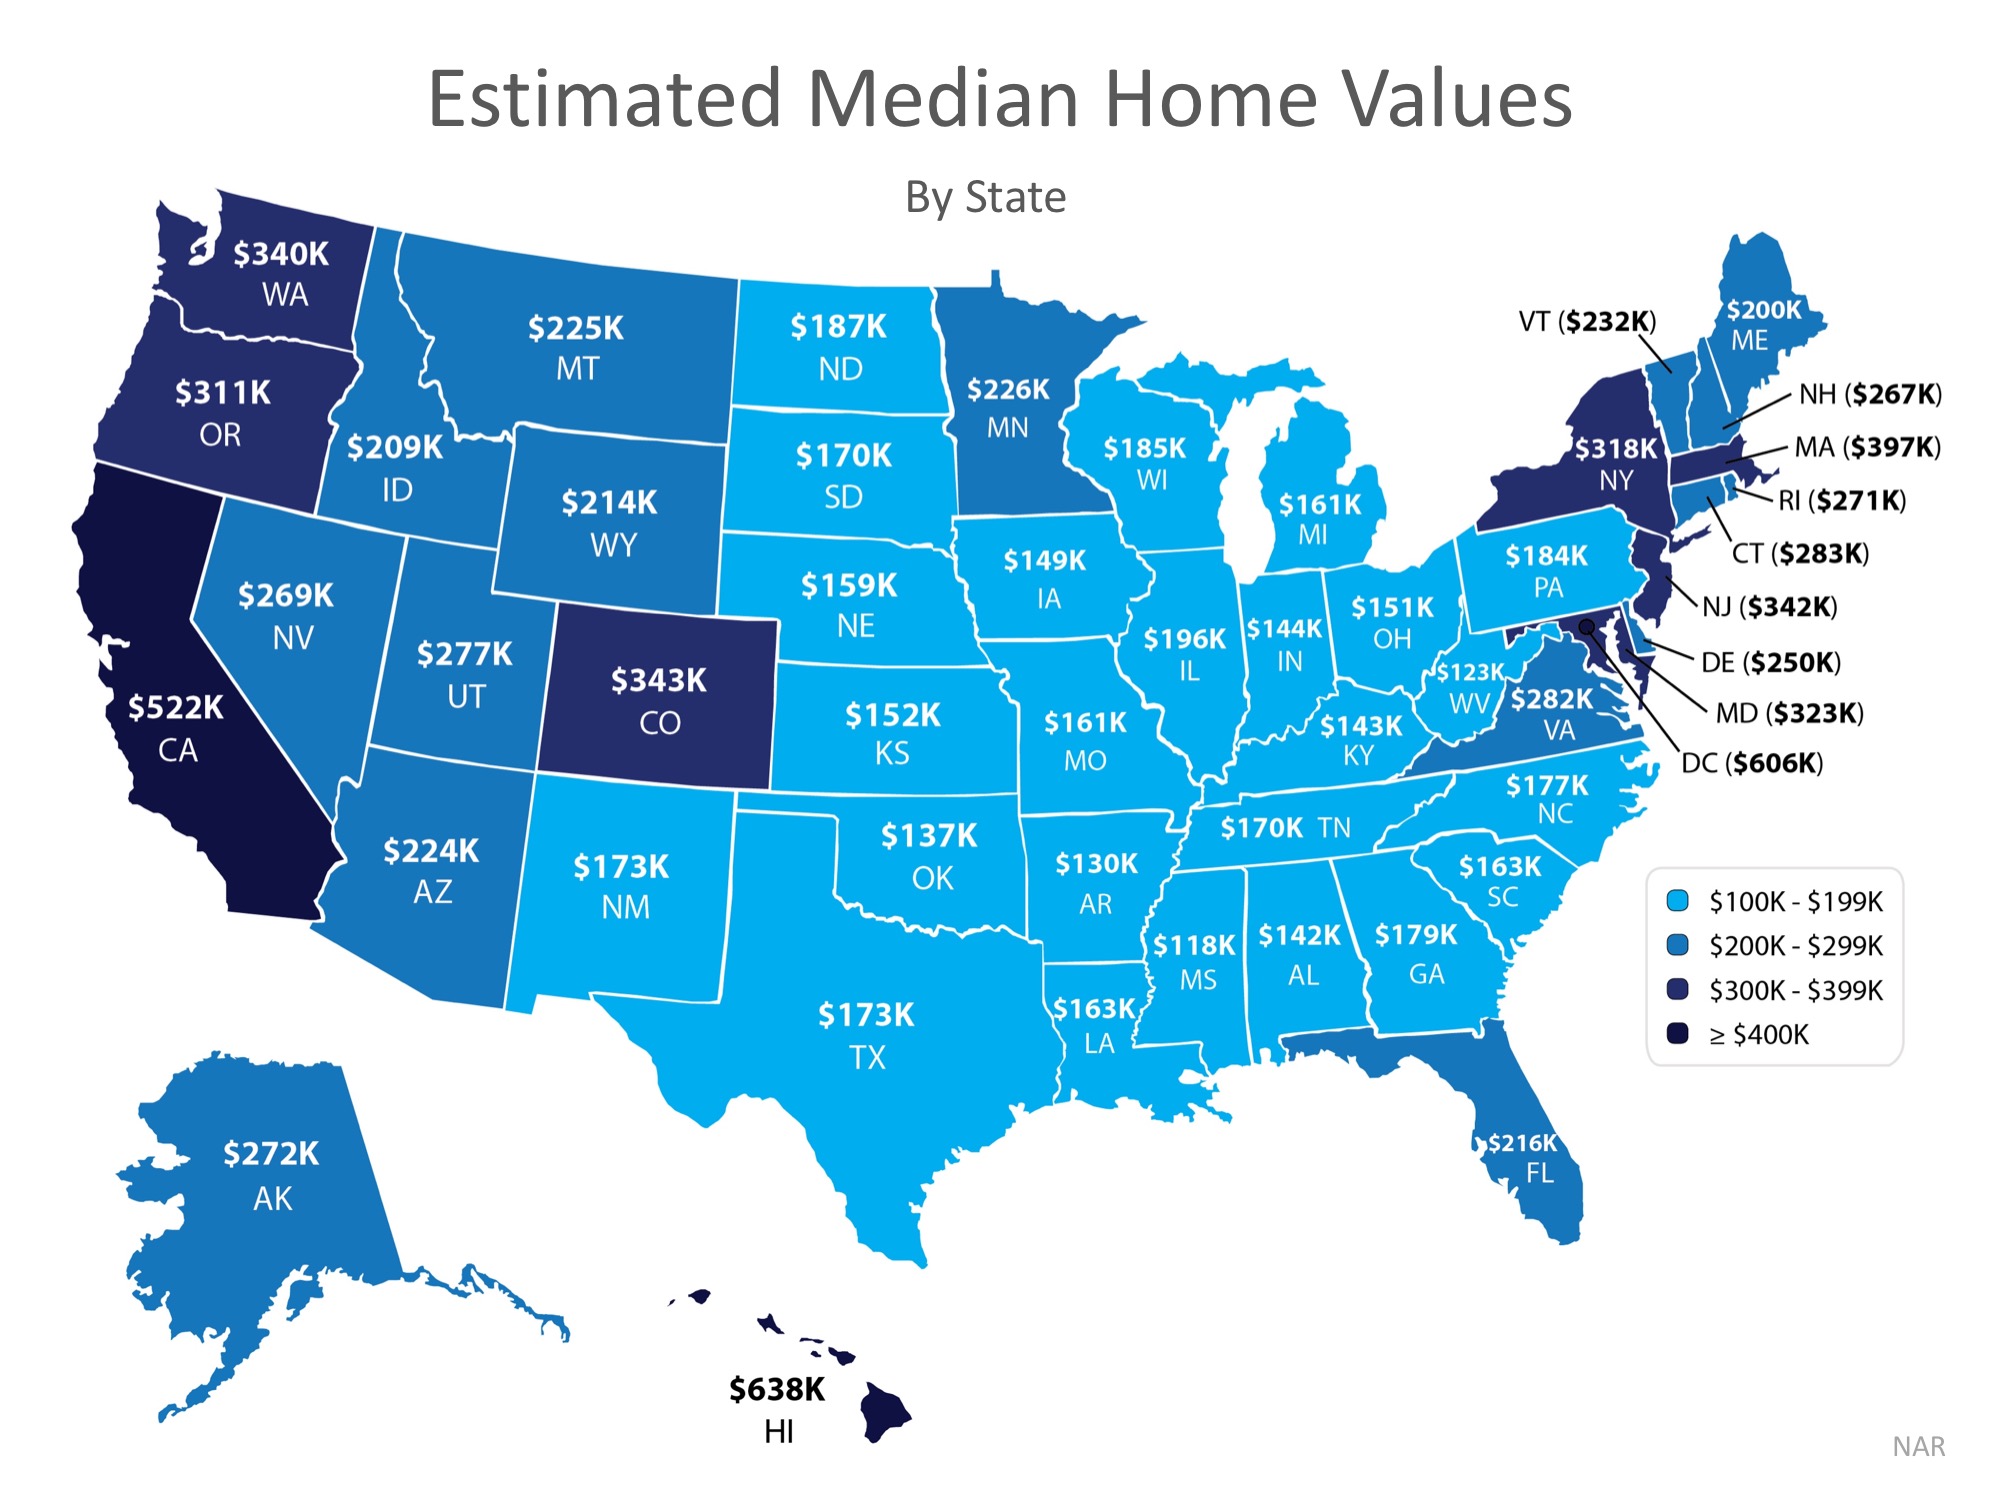
In today’s housing market where home prices are appreciating quickly, it’s important to know that not every home appreciates at the same rate. The map below demonstrates that point on a state-by-state basis using data from the National Association of Realtors.

What’s the Median Home Value in Your State? | Simplifying The Market

Demand often dictates value, even for houses in the same area of the country! High demand for starter and trade-up homes have driven prices up in these categories by nearly 10% over the past year, while those in the premium markets have appreciated at closer to 6%.

Bottom Line

If you are debating whether or not to buy and/or sell a home this year, let’s get together to help you figure out exactly what’s going on in our market.

4 Reasons to Sell This Summer [INFOGRAPHIC]

4 Reasons to Sell This Summer [INFOGRAPHIC] | Simplifying The Market


Some Highlights:

  • Buyer demand continues to outpace the supply of homes for sale which means that buyers are often competing with one another for the few listings that are available!
  • Housing inventory is still under the 6-month supply needed to sustain a normal housing market.
  • Perhaps the time has come for you and your family to move on and start living the life you desire.

Homes are More Affordable in 44 out of 50 States

Homes are More Affordable in 44 out of 50 States | Simplifying The Market

With both home prices and mortgage rates increasing this year, many are concerned about a family’s ability to purchase a major part of the American Dream – its own home. However, if we compare housing affordability today to the average affordability prior to the housing boom and bust, we are in much better shape than most believe.

In Black Knight’s latest monthly Mortgage Monitor, they revealed that in the vast majority of the country, it is actually more affordable to purchase a home today than it was between 1995 to 2003 when looking at mortgage payments (determined by price and interest rate) as compared to incomes. Home prices are up compared to 1995-2003, but mortgage rates are still much lower now than at that time. Today, they stand at about 4.5%. Here are the average mortgage rates for each of the years mentioned:

  • 1995 – 7.93%
  • 1996 – 7.81%
  • 1997 – 7.6%
  • 1998 – 6.94%
  • 1999 – 7.44%
  • 2000 – 8.05%
  • 2001 – 6.97%
  • 2002 – 6.54%
  • 2003 – 5.83%

On the other hand, wages have risen over the last twenty years.

Black Knight’s research revealed that, when comparing “the share of median income required to buy the median-priced home” today, to the average between 1995 to 2003, it is currently more affordable to purchase a home in 44 of 50 states.

Here is a state map of the percentage change in the price-to-payment ratio. Positive numbers indicate that it is less affordable to buy while negative numbers indicate that it is more affordable.

Homes are More Affordable in 44 out of 50 States | Simplifying The Market

Bottom Line

Whether you are moving up to the home of your dreams or purchasing your first house, it is a great time to buy when looking at historic affordability data.

How A Lack of Inventory Impacts the Housing Market

The housing crisis is finally in the rear-view mirror as the real estate market moves down the road to a complete recovery. Home values are up, home sales are up, and distressed sales (foreclosures and short sales) have fallen to their lowest points in years. The market will continue to strengthen in 2018.

However, there is one thing that may cause the industry to tap the brakes: a lack of housing inventory. Buyer demand naturally increases during the summer months, but supply is not keeping up.

Here are the thoughts of a few industry experts on the subject:

Lawrence Yun, Chief Economist at National Association of Realtors

“The worsening inventory crunch through the first three months of the year inflicted even more upward pressure on home prices in a majority of markets. Following the same trend over the last couple of years, a strengthening job market and income gains are not being met by meaningful sales gains because of unrelenting supply and affordability headwinds.”

Sam Khater, Chief Economist for Freddie Mac

“As we head into late spring, the demand for purchase credit remains rock solid, which should set us up for another robust summer home sales season. While this year’s high rates – up 50 basic points from a year ago – have put pressure on the budgets of some home shoppers, weak inventory levels are what’s keeping the housing market from a stronger sales pace.”

Javier Vivas, Director of Economic Research for Realtor.com

“The dynamics of increased competition and buyer frustration are unlikely to change…In fact, the direction of the trend is pointing to a growing mismatch between the pool of prospective buyers and existing inventory.”

Bottom Line

If you are thinking of selling, now may be the time. Demand for your house will be strong at a time when there is very little competition. That could lead to a quick sale for a really good price.

Top 4 Home Renovations for Max ROI [INFOGRAPHIC]

Top 4 Home Renovations for Max ROI [INFOGRAPHIC] | Simplifying The Market

Top 4 Home Renovations for Max ROI [INFOGRAPHIC] | Simplifying The Market

Some Highlights:

  • Whether you are selling your home, just purchased your first home or are a homeowner planning to stay put for a while, there is value in knowing which home improvement projects will net you the most Return On Investment (ROI).
  • Minor bathroom renovations can go a long way toward improving the quality of your everyday life and/or impressing potential buyers.
  • Upgrading your landscaping or curb appeal helps get buyers in the door. These upgrades rank as the 2nd and 4th renovations for returns on investment.

Are Lending Standards Too Loose…or Too Tight?

Are Lending Standards Too Loose…or Too Tight? | Simplifying The Market

With home values appreciating at record rates, some are concerned that we may be heading for another housing bubble like the one we experienced a decade ago. One of the major culprits of that housing boom and bust was the loosening of standards for mortgage credit.

In a study done at the University of North Carolina immediately after the crisis, it was revealed that:

“Lenders began originating large numbers of high risk mortgages from around 2004 to 2007, and loans from those vintage years exhibited higher default rates than loans made either before or after.”

A study by John V Duca, John Muellbauer, and Anthony Murphy concluded that those risky mortgages caused the housing crisis:

“Our findings indicate that swings in credit standards played a major, if not the major, role in driving the recent boom and bust in US house prices.”

How do today’s mortgage standards compare to those from 2004 to 2007?

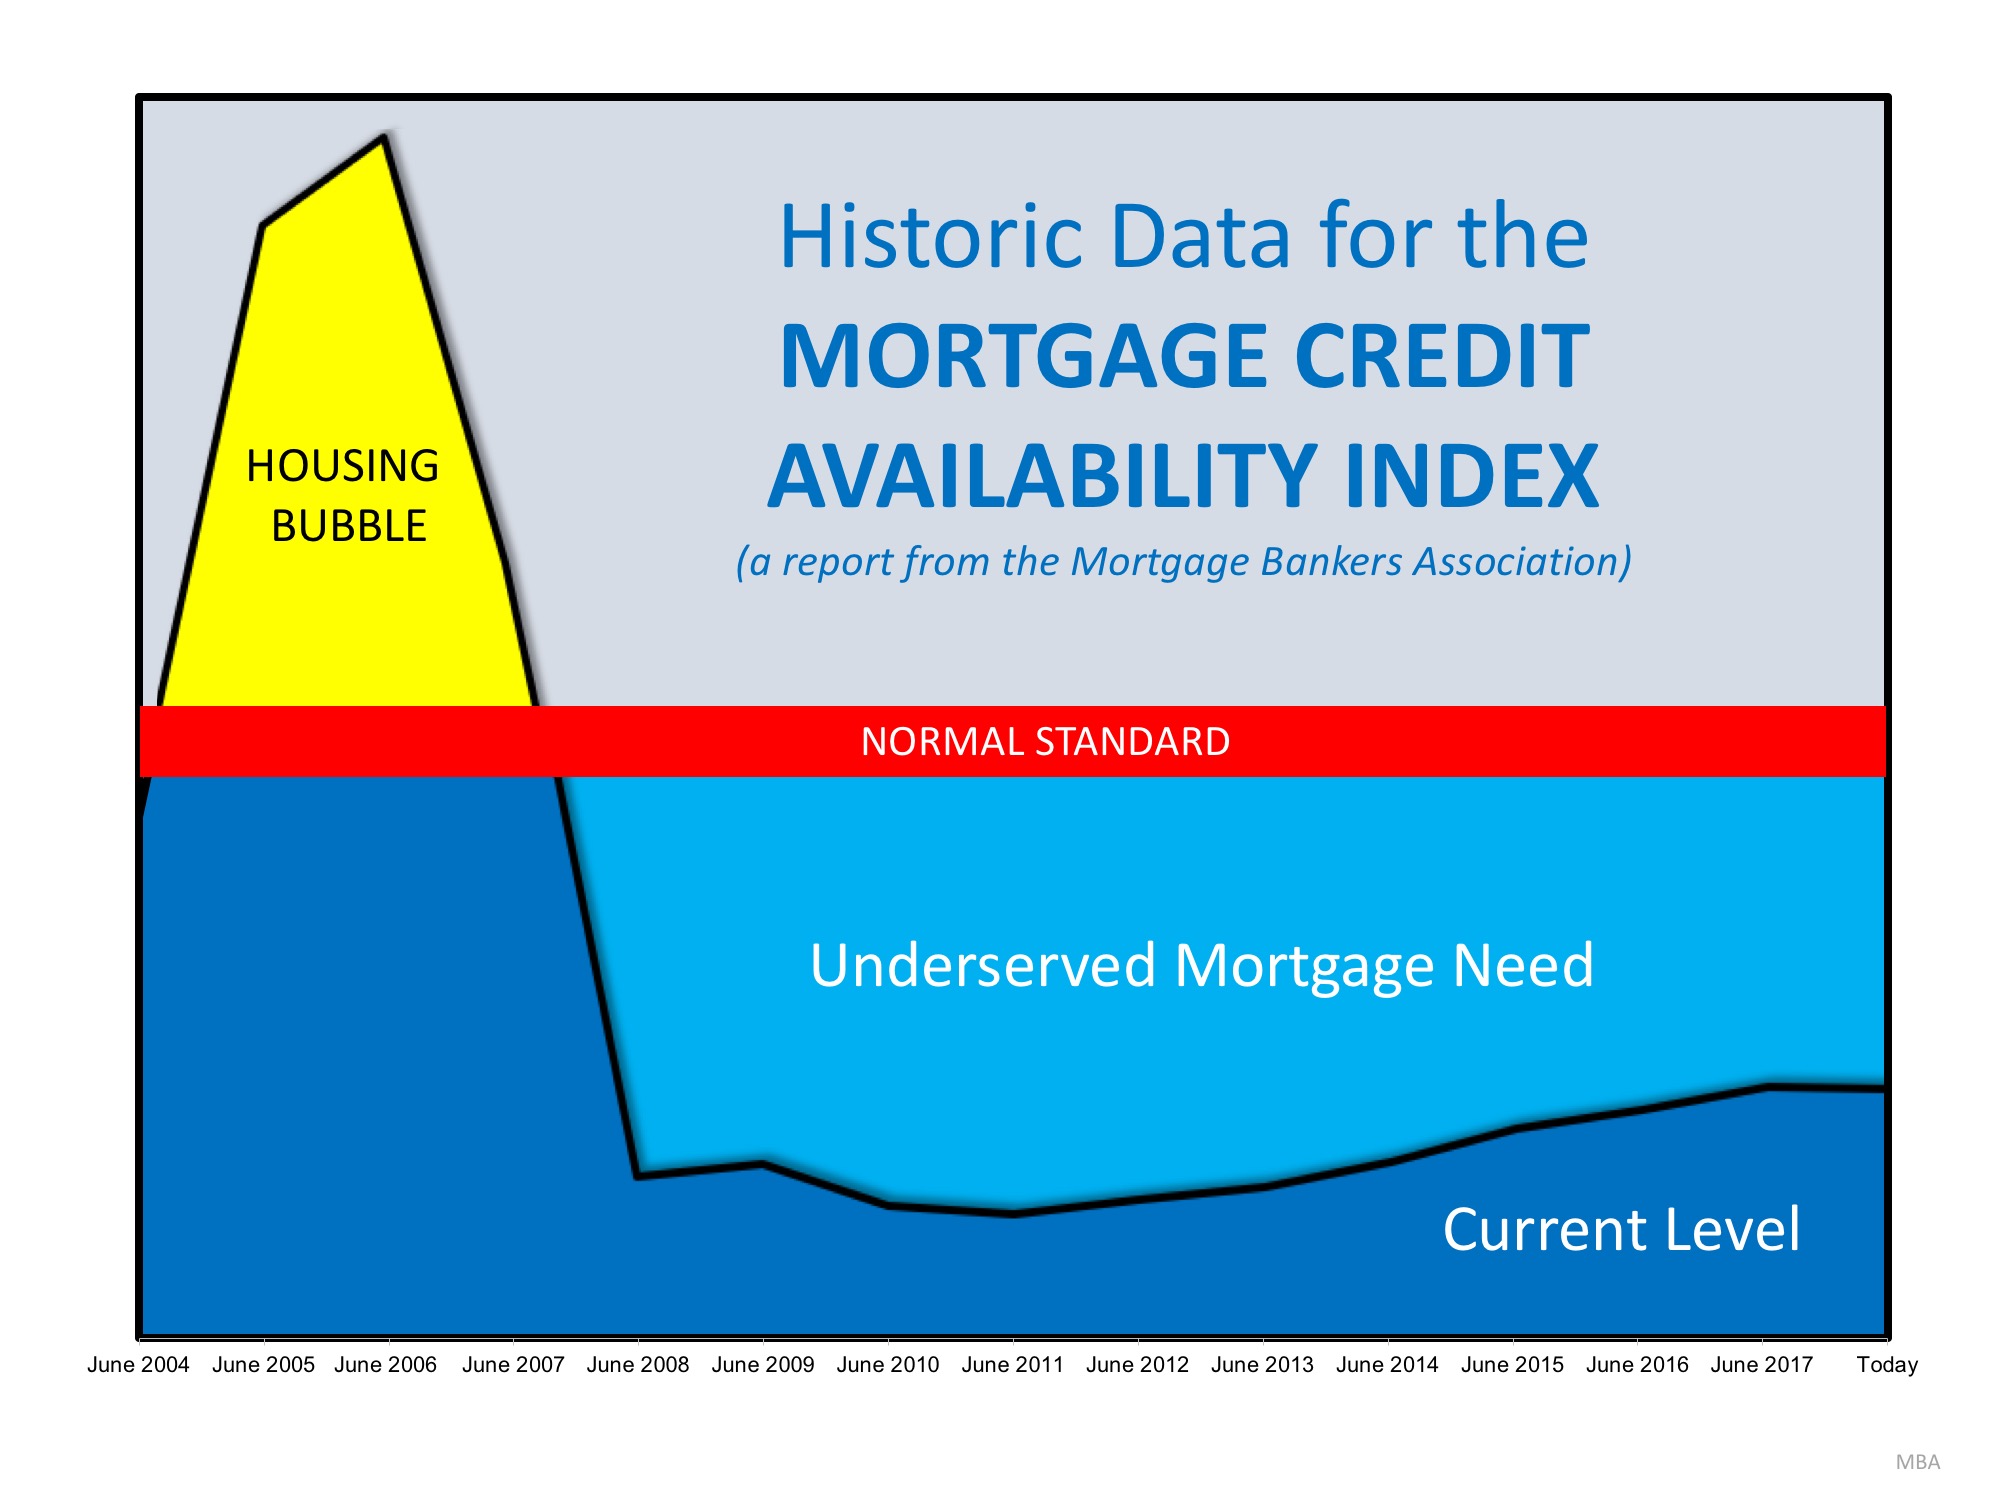
The Mortgage Bankers’ Association tracts mortgage standards in their Mortgage Credit Availability Index (MCAI). A decline in the MCAI indicates that lending standards are tightening, while increases in the index are indicative of loosening credit. While the chart below shows the index going back to that period between 2004 and 2007 when loose standards caused the housing bubble, we can see that, though the index has risen slightly over the last several years, we are nowhere near the standards that precipitated the housing crisis.

Are Lending Standards Too Loose…or Too Tight? | Simplifying The Market

Bottom Line

If anything, standards today are too tight and are preventing some qualified buyers from getting the mortgage credit they deserve.