Category Archives: Move-Up Buyers

Auto Added by WPeMatico

The Cost of NOT Paying PMI

The Cost of NOT Paying PMI | Simplifying The Market

Saving for a down payment is often the biggest hurdle for a first-time homebuyer as median incomes, rents, and home prices all vary depending on where you live.

There is a common misconception among homebuyers that a 20% down payment is required, and it is this limiting belief that often adds months, and sometimes even years, to the home-buying process.

So, if you can purchase a home with less than a 20% down payment… why aren’t more people doing just that?

One Possible Answer: Private Mortgage Insurance (PMI)

Freddie Mac defines PMI as:

“An insurance policy that protects the lender if you are unable to pay your mortgage. It’s a monthly fee, rolled into your mortgage payment, that is required for all conforming, conventional loans that have down payments less than 20%.

Once you’ve built equity of 20% in your home, you can cancel your PMI and remove that expense from your mortgage payment.”

As the borrower, you pay the monthly premiums for the insurance policy, and the lender is the beneficiary. The monthly cost of your PMI depends on the home’s value, the amount of your down payment, and your credit score.

Below is a table showing the difference in monthly mortgage payment for a $250,000 home with a 3% down payment and PMI vs. a 20% down payment without PMI:

The Cost of NOT Paying PMI | Simplifying The Market

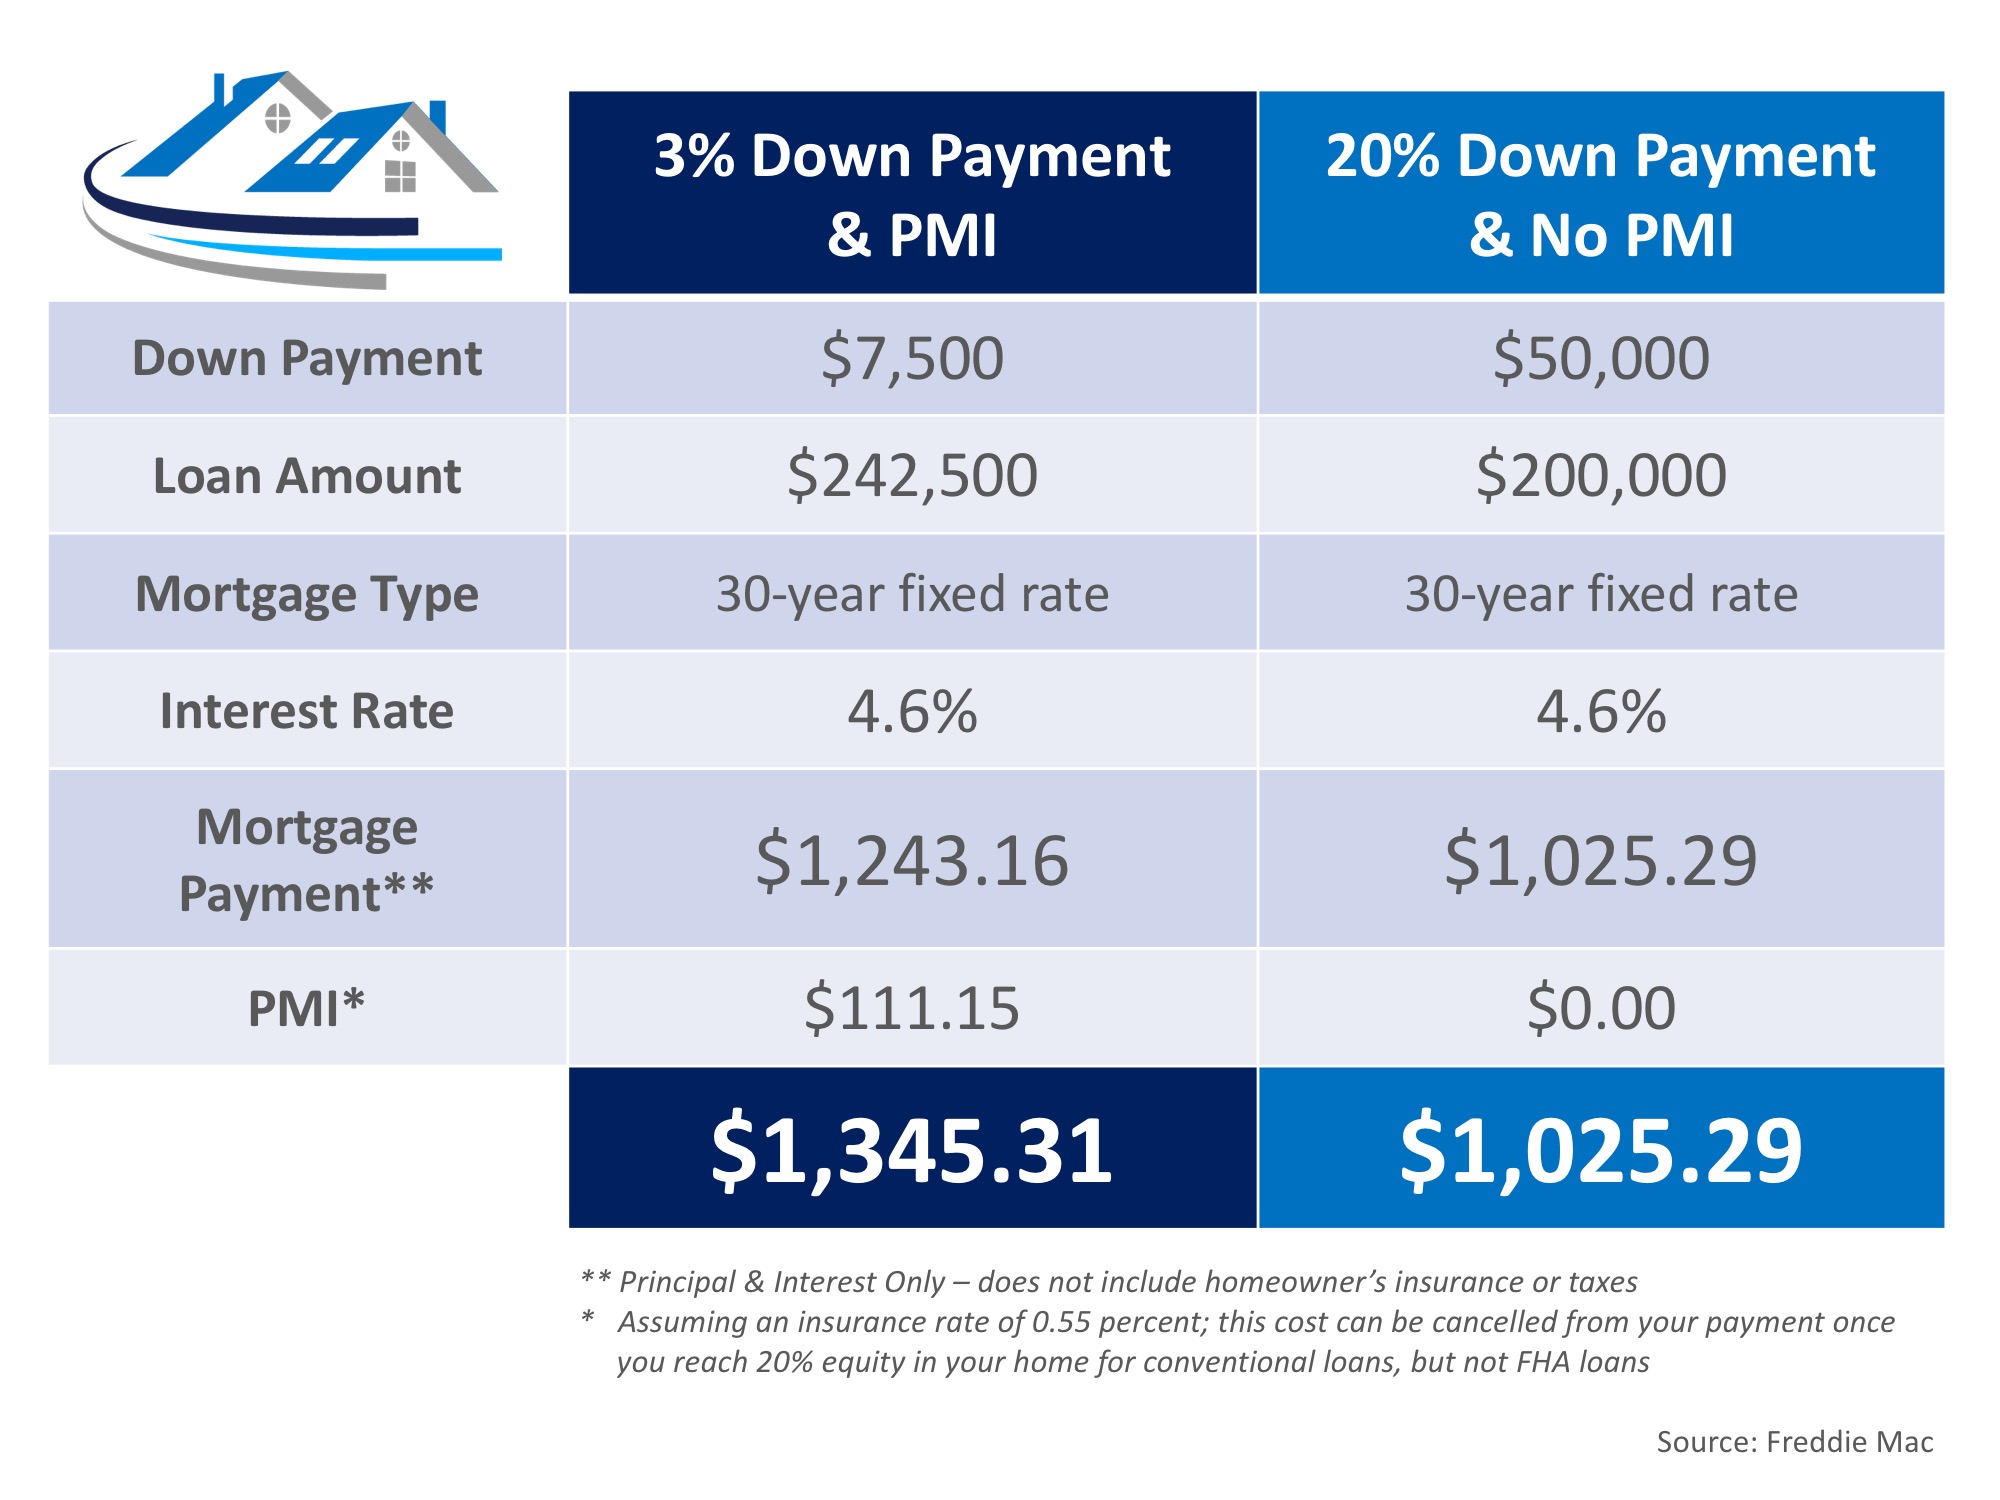
The first thing you see when looking at the table above is no doubt the added $320 a month that you would be spending on your monthly mortgage cost. The second thing that should stand out is that a 20% down payment is $50,000!

If you are buying your first home, $50,000 is a large sum of money that takes discipline and sacrifice to save. Many first-time buyers save for 5-10 years before buying their homes.

To save $50,000 in 10 years, you would need to save about $420 a month. On the other hand, if you save that same $420 a month, you could afford a 3% down payment in less than a year and a half.

In a recent article by My Mortgage Insider, they explain what could happen in the market while you are waiting to save for a higher down payment:

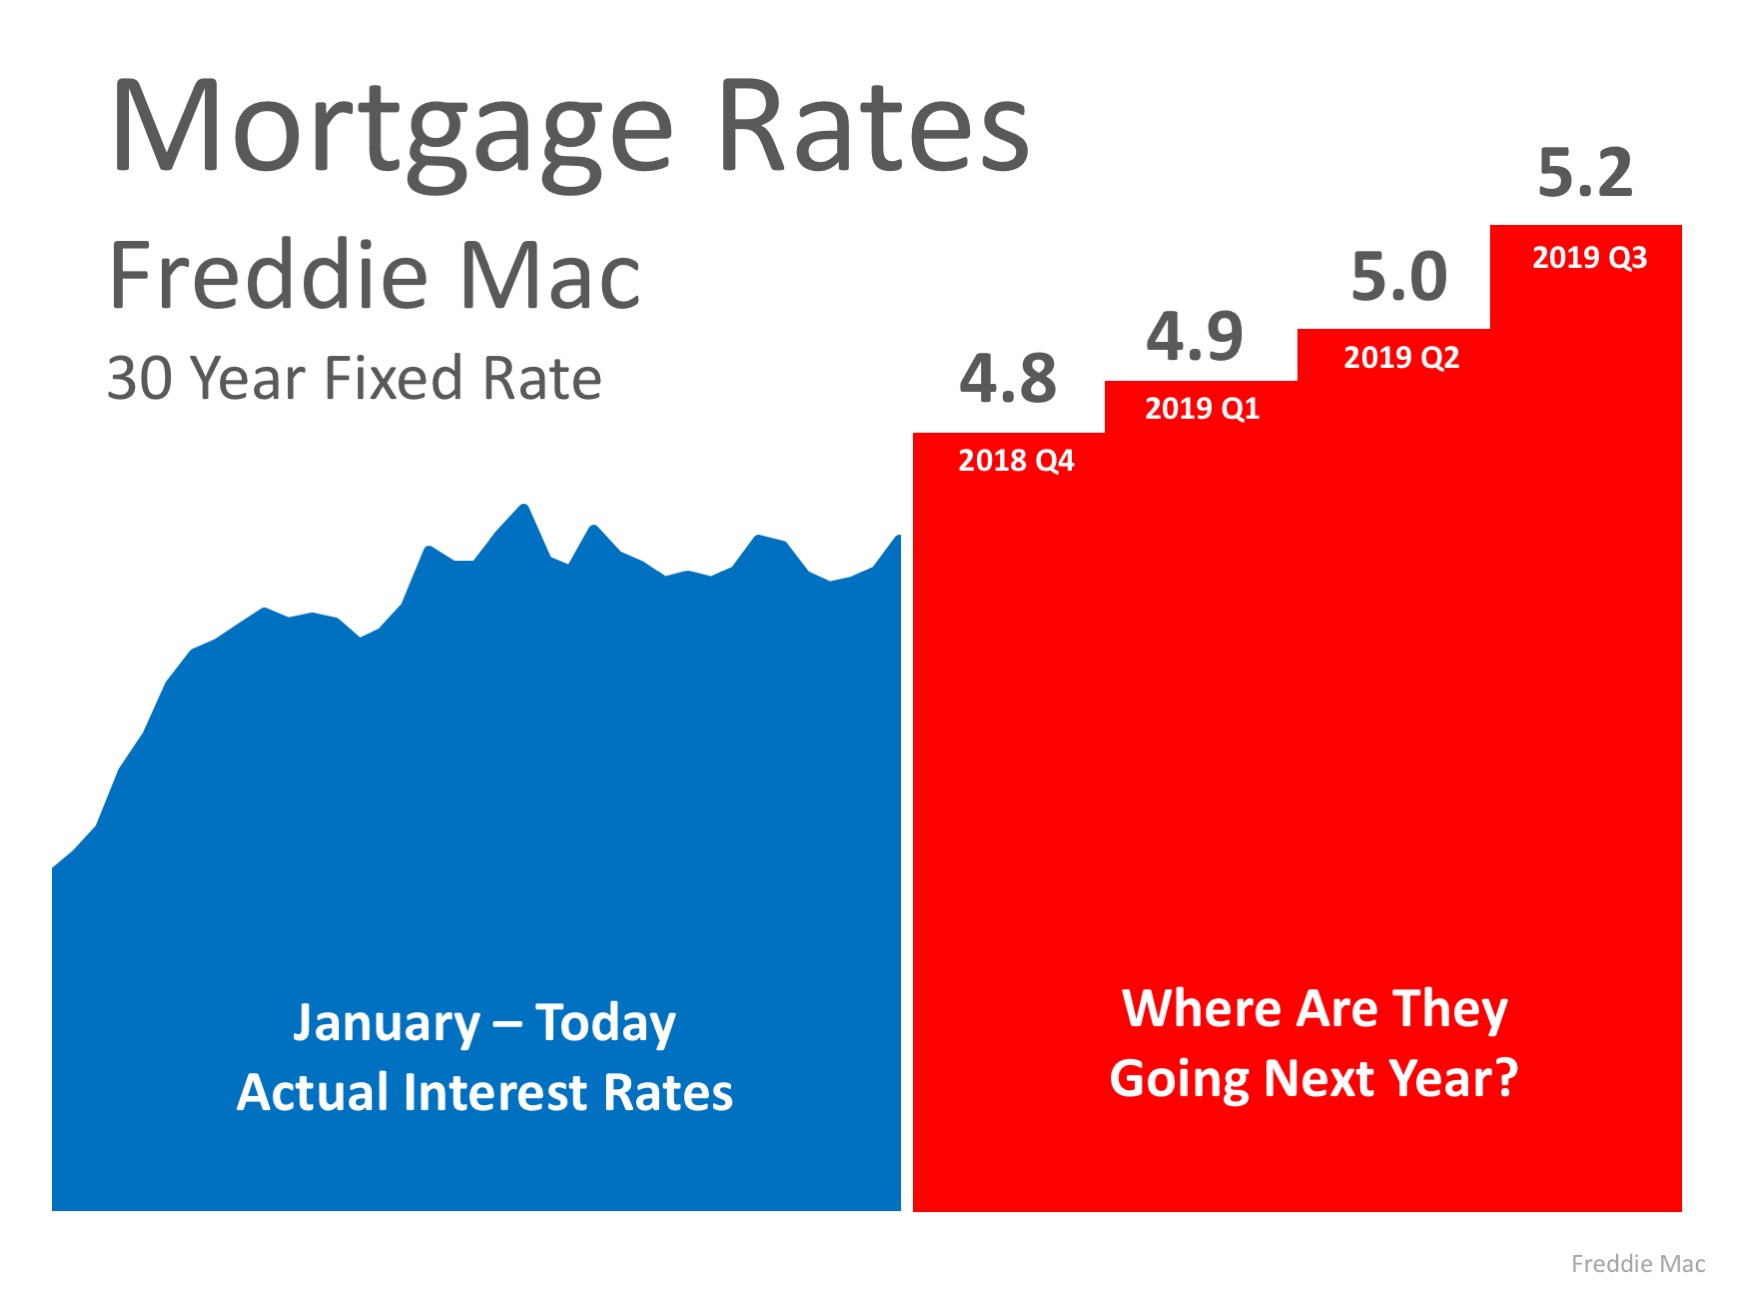
“The time it takes to save a (larger) down payment could mean higher home prices and tougher qualifying down the road. For many buyers, it could prove much cheaper and quicker to opt for the 3% down mortgage immediately.”

The article went on to say,

“Since renters typically devote a higher percentage of their income to housing than homeowners, providing flexible down payment options can help renters with solid earnings purchase a home – and gain a fixed-rate mortgage with principal and interest payments that will not increase over the life of the loan.”

If the prospect of having to pay PMI is holding you back from buying a home today, Freddie Mac has this advice,

“It’s no doubt an added cost, but it’s enabling you to buy now and begin building equity versus waiting 5 to 10 years to build enough savings for a 20% down payment.”

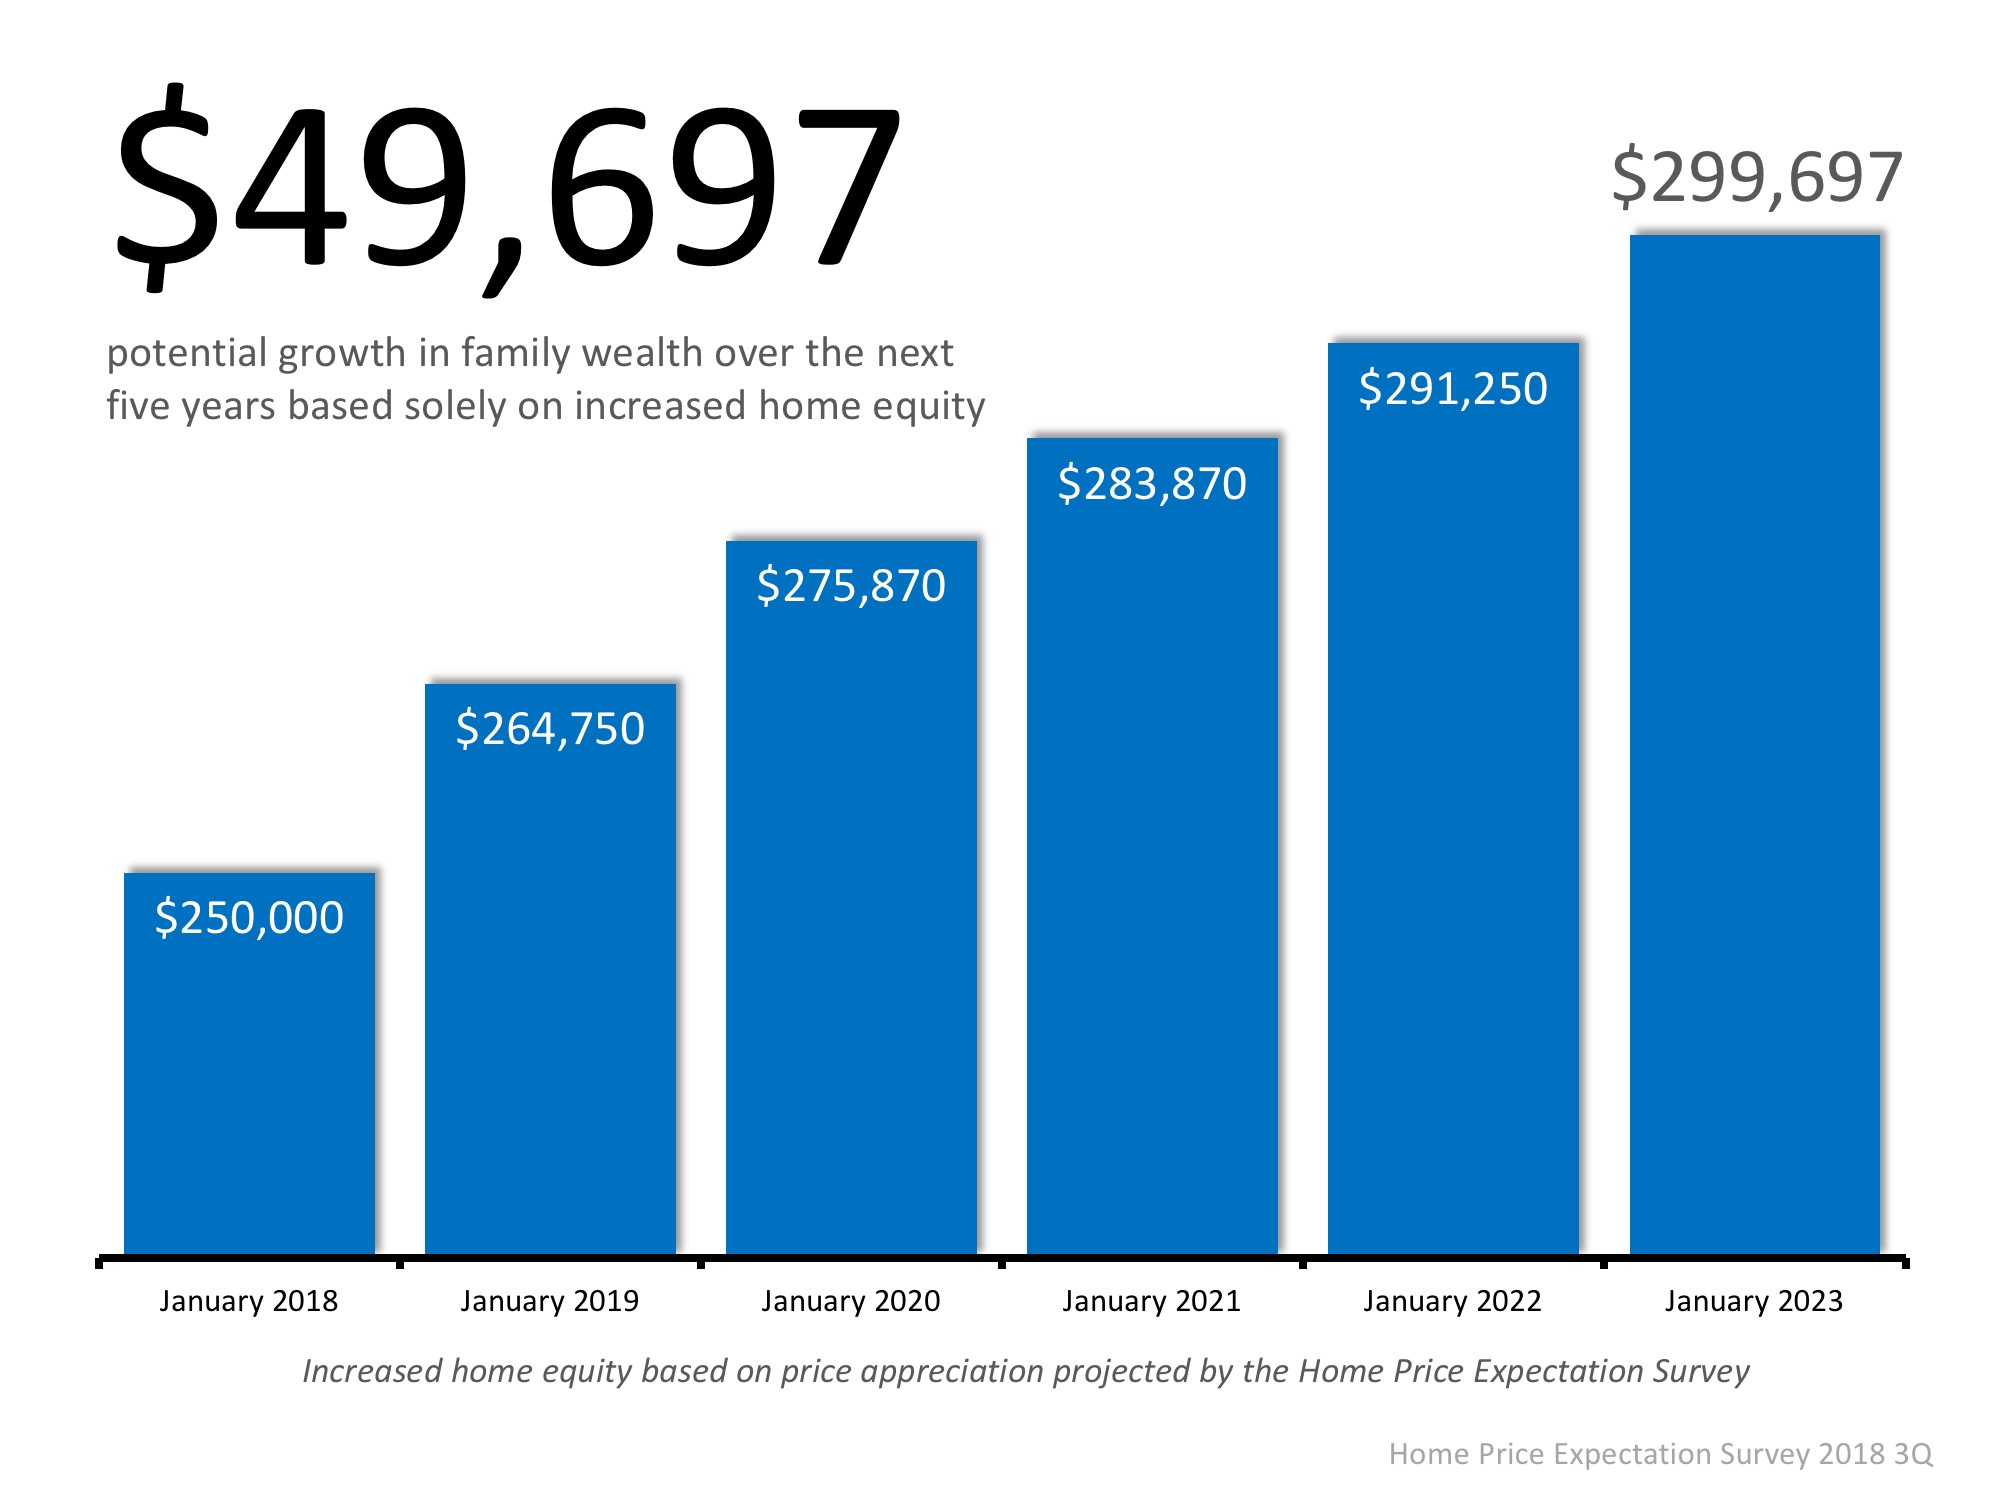
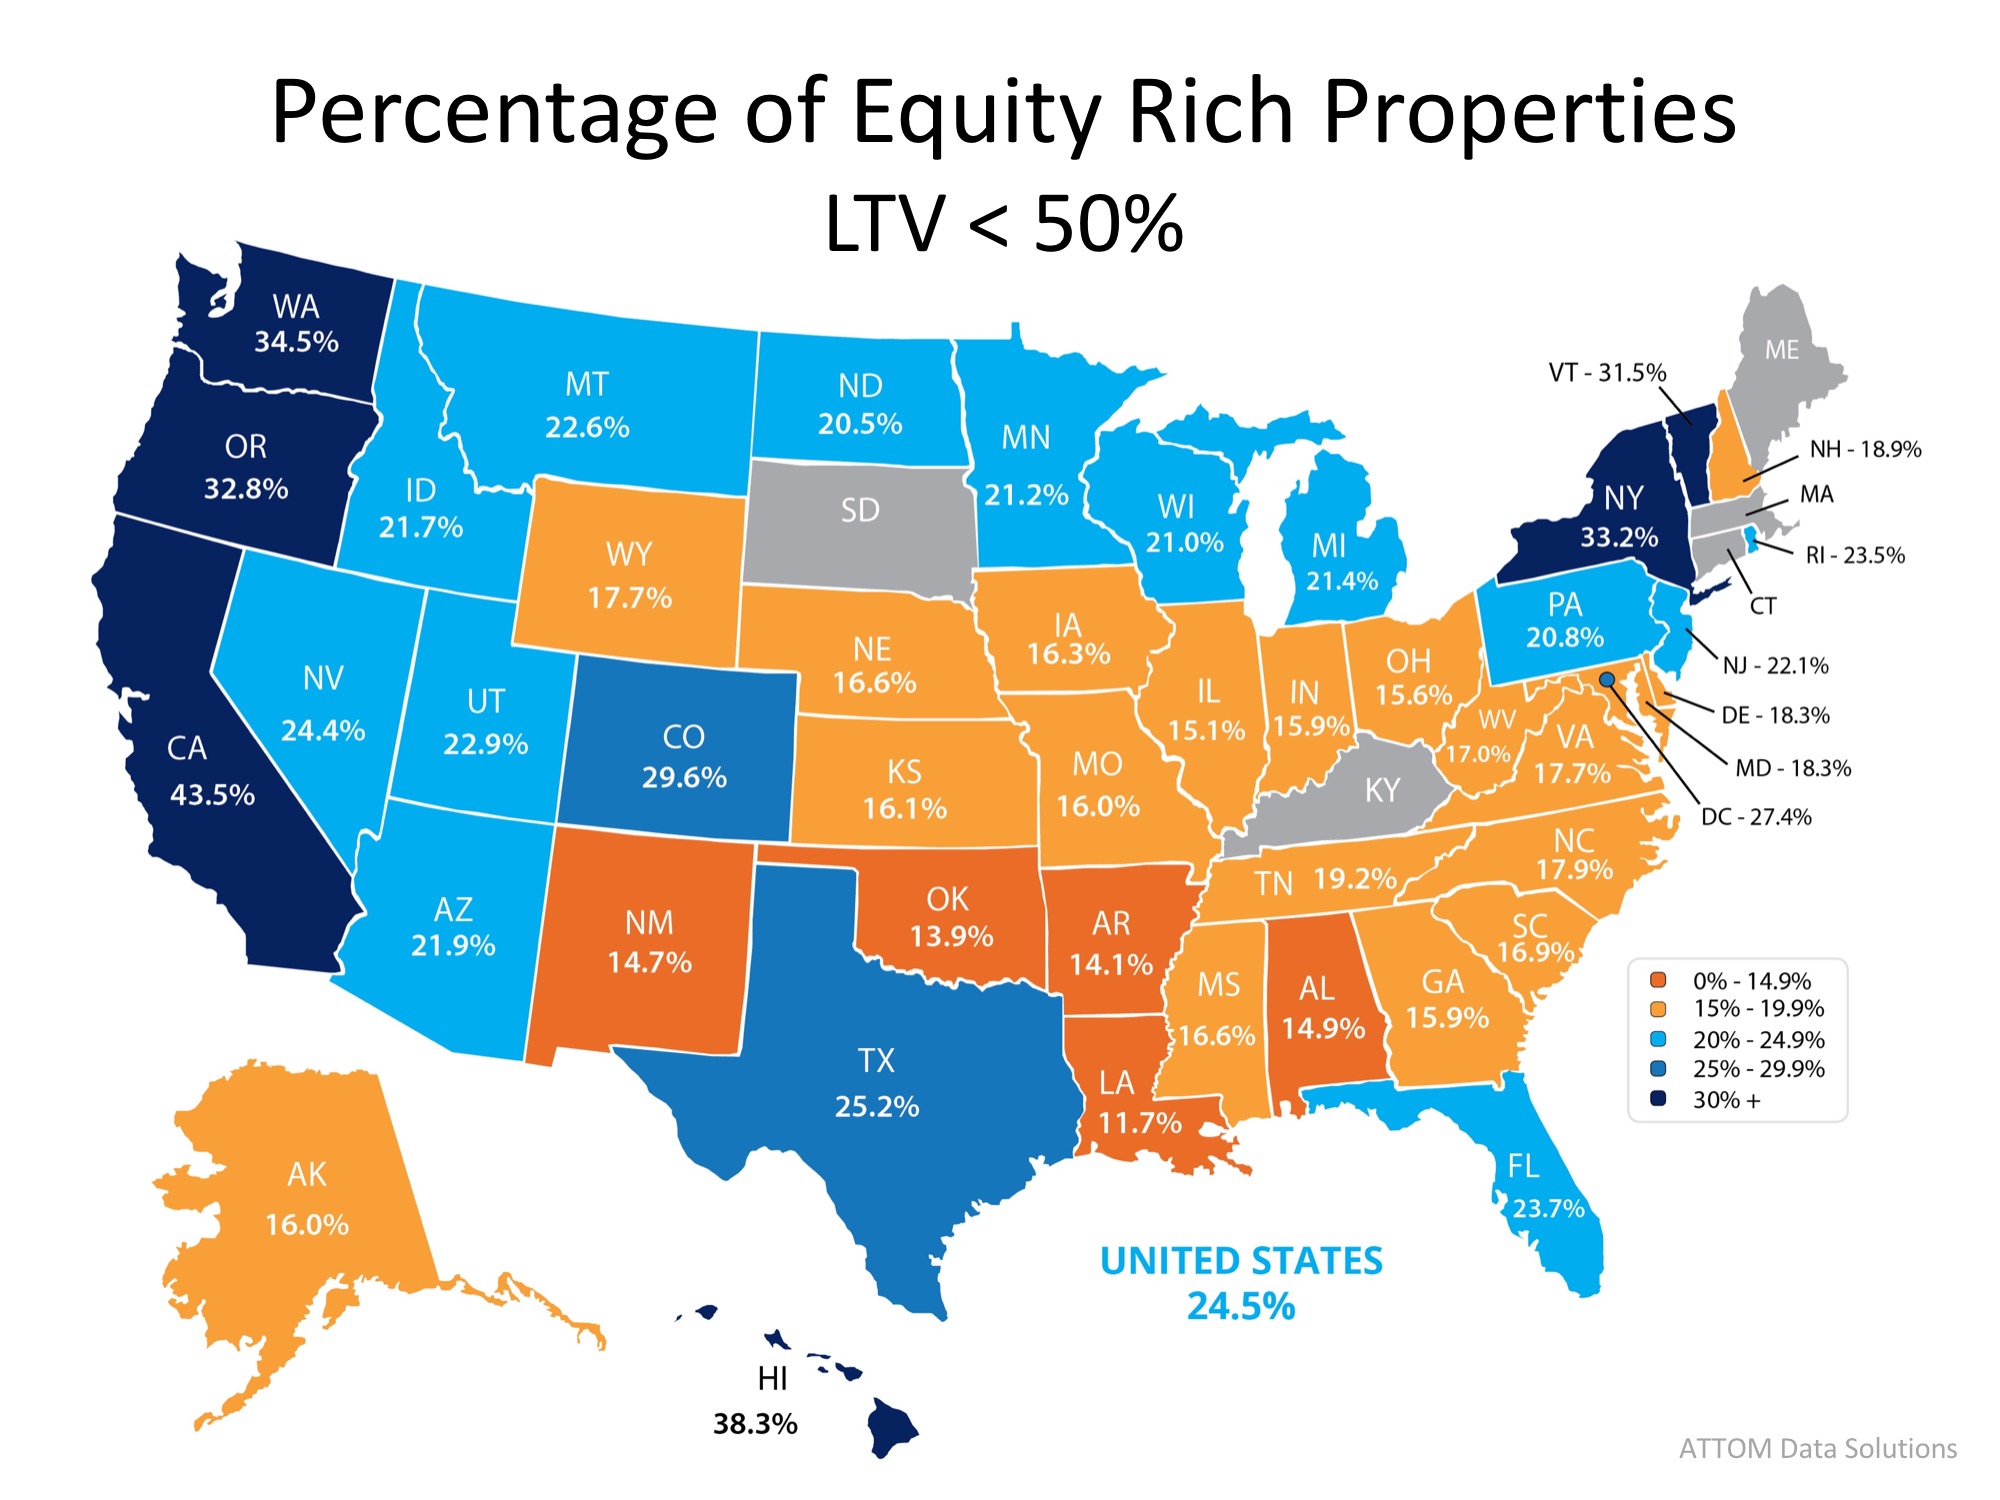
Based on results of the most recent Home Price Expectation Survey, a homeowner who purchased a $250,000 home in January would gain $50,000 in equity over the next five years based on home price appreciation alone (shown below).

The Cost of NOT Paying PMI | Simplifying The Market

Bottom Line

If you have questions about whether you should buy now or wait until you’ve saved a larger down payment, let’s get together to discuss our market’s conditions and help you make the best decision for you and your family.

Where Are Mortgage Interest Rates Headed In 2019?

Where Are Mortgage Interest Rates Headed In 2019? | Simplifying The Market

The interest rate you pay on your home mortgage has a direct impact on your monthly payment; the higher the rate, the greater the payment will be. That is why it is important to know where rates are headed when deciding to start your home search.

Below is a chart created using Freddie Mac’s U.S. Economic & Housing Marketing Outlook. As you can see, interest rates are projected to increase steadily over the course of the next year.

Where Are Mortgage Interest Rates Headed In 2019? | Simplifying The Market

How Will This Impact Your Mortgage Payment?

Depending on the amount of the loan that you secure, a half of a percent (.5%) increase in interest rate can increase your monthly mortgage payment significantly.

According to CoreLogic’s latest Home Price Index, national home prices have appreciated 6.2% from this time last year and are predicted to be 5.1% higher next year.

If both the predictions of home price and interest rate increases become a reality, families would wind up paying considerably more for their next homes.

Bottom Line

Even a small increase in interest rate can impact your family’s wealth, so don’t wait until next year! Let’s get together to evaluate your ability to purchase your dream home now.

How Much Has Your Home Increased in Value?

How Much Has Your Home Increased in Value? | Simplifying The Market

Home values have risen dramatically over the last twelve months. In CoreLogic’s most recent Home Price Index Report, they revealed that national home prices have increased by 6.2% year-over-year.

CoreLogic broke down appreciation even further into four price ranges, giving us a more detailed view than if we had simply looked at the year-over-year increases in national median home price.

The chart below shows the four price ranges from the report, as well as each one’s year-over-year growth from July 2017 to July 2018 (the latest data available). 

How Much Has Your Home Increased in Value? | Simplifying The Market

It is important to pay attention to how prices are changing in your local market. The location of your home is not the only factor which determines how much your home has appreciated over the course of the last year.

Lower-priced homes have appreciated at greater rates than homes at the upper ends of the spectrum due to demand from first-time home buyers and baby boomers looking to downsize.

Bottom Line

If you are planning to list your home for sale in today’s market, let’s get together to go over exactly what’s going on in your area and your price range.

25% of Homes with a Mortgage are Now Equity Rich!

25% of Homes with a Mortgage are Now Equity Rich! | Simplifying The Market

Rising home prices have been in the news a lot lately and much of the focus has been on whether home prices are accelerating too quickly, as well as how sustainable the growth in prices really is. One of the often-overlooked benefits of rising prices, however, is the impact that they have on a homeowner’s equity position.

Home equity is defined as the difference between the home’s fair market value and the outstanding balance of all liens (loans) on the property. While homeowners pay down their mortgages, the amount of equity they have in their homes climbs each time the value of their homes go up!

According to the latest Equity Report from ATTOM Data Solutions, “13.9 million U.S. properties in Q2 2018 were equity rich — where the combined estimated balance of loans secured by the property was 50 percent or less of the property’s estimated market value — representing 24.9% of all U.S. properties with a mortgage.”

This means that nearly a quarter of Americans who have a mortgage would be able to sell their homes and have a significant down payment toward their next home. Many who sell could also use their new-found equity to pay off high-interest credit cards or help children with tuition costs.

The map below shows the percentage of properties with a mortgage in each state that were equity rich in Q2 2018.

25% of Homes with a Mortgage are Now Equity Rich! | Simplifying The Market

Bottom Line

If you are a homeowner looking to take advantage of your home equity by moving up to your dream home, let’s get together to discuss your options!

If You Are Thinking of Selling? You Must Act NOW!

If You Are Thinking of Selling? You Must Act NOW! | Simplifying The Market

If you thought about selling your house this year, now more than ever may be the time to do it! The inventory of homes for sale is well below historic norms and buyer demand is skyrocketing. We were still in high school when we learned about the concept of supply and demand, so we understand that the best time to sell something is when the supply of that item is low and demand for that item is high. That defines today’s real estate market.

Lawrence Yun, Chief Economist at the National Association of Realtors, recently commented:

Contract signings inched backward once again last month, as declines in the South and West weighed down on overall activity.”

Yun goes on to say:

The reason sales are falling off last year’s pace is that multiple years of inadequate supply in markets with strong job growth have finally driven up home prices to a point where an increasing number of prospective buyers are unable to afford it.”

In this type of market, a seller may hold a major negotiating advantage when it comes to price and other aspects of the real estate transaction, including the inspection, appraisal and financing contingencies.

Bottom Line

As a potential seller, you are in the driver’s seat right now. It might be time to hit the gas.

Are Homebuyers Starting to Hit the ‘Pause’ Button?

Are Homebuyers Starting to Hit the ‘Pause’ Button? | Simplifying The Market

For the last several years, buyer demand has far exceeded the housing supply available for sale. This low supply and high demand have led to home prices appreciating by an average of 6.2% annually since 2012.

With this being said, three of the four major reports used to measure buyer activity have revealed that purchasing demand may be softening. Here are the four indices, how they measure demand (methodology), what their latest reports said, and a quick synopsis of the report.

The Foot Traffic Report
by the National Association of Realtors

Methodology: Every month SentriLock, LLC provides NAR Research with data on the number of properties shown by a REALTOR®. Lockboxes made by SentriLock, LLC are used in roughly a third of home showings across the nation. Foot traffic has a strong correlation with future contracts and home sales, so it can be viewed as a peek ahead at sales trends two to three months into the future.

Latest Report: “Foot Traffic climbed 3.2 points to 55.8 mid-summer in July. Additionally, the diffusion index is higher than last year by 13.5 points. Despite a healthy economy and labor market, supply and new construction remains unable to keep up with buyer demand.”

Synopsis: Buyer demand remains strong.

The Showing Index
by ShowingTime

Methodology: The ShowingTime Showing Index® tracks the average number of buyer showings on active residential properties on a monthly basis, a highly reliable leading indicator of current and future demand trends.

Latest Report: “Showing activity throughout the country increased by 0.3 percent year over year in July, the third consecutive month that the U.S. ShowingTime Showing Index recorded buyer interest deceleration compared to the previous year. The June 2018 figures revealed a 0.0 percent change in showing traffic from 2017, while May showed a 1.2 percent year-over-year increase. The 12-month average year-over-year increase was 4.6 percent.”

Synopsis: Buyer demand is softening

Realtors Confidence Index
by the National Association of Realtors

Methodology: The REALTORS Confidence Index is a key indicator of housing market strength based on a monthly survey sent to over 50,000 real estate practitioners. Practitioners are asked about their expectations for home sales, prices and market conditions.

Latest Report: “REALTORS reported slower homebuying activity in July 2018…The REALTORS® Buyer Traffic Index registered at 62, down from the same month one year ago (69). This is the fifth straight month (since March 2018) that Realtors reported a decline in buyer activity compared to conditions one year ago.”

Synopsis: Buyer demand is softening

The Real Estate Broker Survey
in the ‘Z’ Report by Zelman and Associates (subscription needed)

Methodology: Proprietary survey results of real estate executives.

Latest Report: “While we continue to expect a resumption of growth in resale transactions on the back of easing inventory in 2019 and 2020, our real-time view into the market through our Real Estate Broker Survey does suggest that buyers have grown more discerning of late and a level of “pause” has taken hold in many large housing markets. Indicative of this, our broker contacts rated buyer demand at 69 on a 0-100 scale, still above average but down from 74 last year and representing the largest year-over-year decline in the two-year history of our survey.”

Synopsis: Buyer demand is softening

Bottom Line

Again, three of the four most reliable measures of buyer activity are reporting that demand is softening. We had a strong buyers’ market directly after the housing crash which was immediately followed by a strong sellers’ market over the last six years.

If demand continues to soften and supply begins to grow (as is projected to happen), we will return to a more neutral market which will favor neither buyers nor sellers. This “more normal” market will be better for real estate in the long term.

Home Prices Have Appreciated 6.9% in 2018

Home Prices Have Appreciated 6.9% in 2018 | Simplifying The Market

Between 1987 and 1999, which is often referred to as the ‘Pre-Bubble Period,’ home prices grew at an average of 3.6% according to the Home Price Expectation Survey.

Every month, the economists at CoreLogic release the results of their Home Price Insights Report, which includes the actual year-over-year change in prices across the country and their predictions for the following year.

The chart below shows the forecasted year-over-year prices for 2018 (predictions made in 2017). According to their predictions, the average appreciation over the course of 2018 should be 4.8%, which is still greater than the ‘normal’ appreciation of 3.6%.

Home Prices Have Appreciated 6.9% in 2018 | Simplifying The Market

If we layer in the actual price appreciation that has occurred this year, we can see that over the course of 2018, home prices have appreciated by an average of 6.9% and have outpaced projections all year!

Home Prices Have Appreciated 6.9% in 2018 | Simplifying The Market

What does this mean?

The tale of today’s real estate market is one of low inventory, high demand, and rising prices. The forces at work can be simply explained with the theory of supply and demand. That being said, if a large supply of inventory were to come to the market, prices may start to appreciate closer to the forecasted rate which would STILL be greater than the historic norm!

Bottom Line

If you are a homeowner whose house no longer meets your needs, now may be a great time to list your home and capitalize on the equity you have gained over the last year to make a significant down payment on your next home!

NAR Reports Show It’s A Great Time to Sell!

NAR Reports Show It’s A Great Time to Sell! | Simplifying The Market

We all realize that the best time to sell anything is when the demand for that item is high and the supply of that item is limited. The last two major reports issued by the National Association of Realtors (NAR) revealed information that suggests that right now continues to be a great time to sell your house.

Let’s look at the data covered in the latest Pending Home Sales Report and Existing Home Sales Report.

THE PENDING HOME SALES REPORT

The report announced that pending home sales (homes going into contract) are down 2.3% from last year and have continued to fall on an annual basis for seven straight months.

Lawrence Yun, NAR’s Chief Economist, had this to say:

“The reason sales are falling off last year’s pace is that multiple years of inadequate supply in markets with strong job growth have finally driven up home prices to a point where an increasing number of prospective buyers are unable to afford it.”

Takeaway: Demand for housing is strong and will continue to grow in 2019. Without an influx of new listings for sale, pending home sales will continue to decline. Listing now means you will be able to take advantage of the demand currently in the market.

THE EXISTING HOME SALES REPORT

The most important data point revealed in the report was not sales-based, but was instead the inventory of homes for sale (supply). The report explained:

  • Total housing inventory decreased 0.7% to 5.34 million homes available for sale in July
  • This represents a 4.3-month supply at the current sales pace
  • Sales are now 1.5% below a year ago

There were two more interesting comments made by Yun in the report:

“Led by a notable decrease in closings in the Northeast, existing home sales trailed off again last month, sliding to their slowest pace since February 2016 at 5.21 million.”

In real estate, there is a guideline that often applies: When there is less than a 6-month supply of inventory available, we are in a seller’s market and we will see appreciation; between 6-7 months is a neutral market, where prices will increase at the rate of inflation; and more than a 7-month supply means we are in a buyer’s market and should expect depreciation in home values. As Yun notes, we are (and will remain) in a seller’s market and prices will continue to increase unless more listings come to the market.

“Listings continue to go under contract in under a month, which highlights the feedback from Realtors® that buyers are swiftly snatching up moderately-priced properties. Existing supply is still not at a healthy level, and new home construction is not keeping up to meet demand.”

Takeaway: Inventory of homes for sale is still well below the 6-month supply needed for a normal market. Prices will continue to rise if a sizable supply does not enter the market.

Bottom Line

If you are going to sell, now may be the time to take advantage of the ready, willing, and able buyers that are still out looking for your house.

4 Reasons Why Fall Is A Great Time to Buy A Home!

4 Reasons Why Fall Is A Great Time to Buy A Home! | Simplifying The Market

Here are four great reasons to consider buying a home today instead of waiting.

1. Prices Will Continue to Rise

CoreLogic’s latest Home Price Insights report reveals that home prices have appreciated by 6.2% over the last 12 months. The same report predicts that prices will continue to increase at a rate of 5.1% over the next year.

Home values will continue to appreciate for years. Waiting no longer makes sense.

2. Mortgage Interest Rates Are Projected to Increase

Freddie Mac’s Primary Mortgage Market Survey shows that interest rates for a 30-year mortgage have already increased by half of a percentage point, to around 4.5% in 2018. Most experts predict that rates will rise over the next 12 months. The Mortgage Bankers Association, Fannie Mae, Freddie Mac and the National Association of Realtors are in unison, projecting that rates will increase by half a percentage point to around 5.1% by this time next year.

An increase in rates will impact your monthly mortgage payment. A year from now, your housing expense will increase if a mortgage is necessary to buy your next home.

3. Either Way, You Are Paying a Mortgage

There are some renters who have not yet purchased homes because they are uncomfortable taking on the obligation of a mortgage. Everyone should realize that unless you are living with your parents rent-free, you are paying a mortgageeither yours or your landlord’s.

As an owner, your mortgage payment is a form of ‘forced savings’ that allows you to build equity in your home which you can then tap into later in life. As a renter, you guarantee your landlord is the person building that equity.

Are you ready to put your housing cost to work for you?

4. It’s Time to Move on with Your Life

The ‘cost’ of a home is determined by two major components: the price of the home and the current mortgage rate. It appears that both are on the rise.

But what if they weren’t? Would you wait?

Look at the actual reason you are buying and decide if it is worth waiting. Whether you want to have a great place for your children to grow up, you want your family to be safer, or you just want to have control over renovations, maybe now is the time to buy.

If the right thing for you and your family is to purchase a home this year, buying sooner rather than later could lead to substantial savings.

Home Prices Up 6.49% Across the Country! [INFOGRAPHIC]

Home Prices Up 6.49% Across the Country! [INFOGRAPHIC] | Simplifying The Market

Some Highlights:

  • The Federal Housing Finance Agency (FHFA) recently released their latest quarterly Home Price Index report.
  • In the report, home prices are compared both regionally and by state.
  • Based on the latest numbers, if you plan on relocating to another state, waiting to move may end up costing you more!