

Every Hour in the US Housing Market:
- 596 Homes Sell
- 278 Homes Regain Positive Equity
- Median Home Values Go Up $1.20



There are many questions about where home sales are headed next year. We have gathered the most reliable sources to help answer this question. Here are our sources:
Mortgage Bankers Association (MBA) – As the leading advocate for the real estate finance industry, the MBA enables members to successfully deliver fair, sustainable, and responsible real estate financing within ever-changing business environments.
The National Association of Realtors (NAR) – The largest association of real estate professionals in the world.
Freddie Mac – An organization which provides liquidity, stability, and affordability to the U.S. housing market in all economic conditions extending to all communities from coast to coast.
Fannie Mae – A leading source of financing for mortgage lenders, providing access to affordable mortgage financing in all markets.

Every source sees home sales growing next year. Let’s get together to chat about what’s going on in our neighborhood.

With home prices on the rise and buyer demand still strong, some sellers may be tempted to try and sell their homes on their own without using the services of a real estate professional.
Real estate agents are trained and experienced in negotiation and, in most cases, the seller is not. Sellers must realize that their ability to negotiate will determine whether or not they get the best deal for themselves and their families.
The percentage of sellers who have hired real estate agents to sell their homes has increased steadily over the last 20 years. Let’s get together to discuss all that we can do to make the process easier for you.

There are many questions about where home prices will be next year as well as where they may be headed over the next several years to come. We have gathered the most reliable sources to help answer these questions:
The Home Price Expectation Survey – A survey of over 100 market analysts, real estate experts, and economists conducted by Pulsenomics each quarter.
Zelman & Associates – The firm leverages unparalleled housing market expertise, extensive surveys of industry executives, and rigorous financial analysis to deliver proprietary research and advice to leading global institutional investors and senior-level company executives.
Mortgage Bankers Association (MBA) – As the leading advocate for the real estate finance industry, the MBA enables members to successfully deliver fair, sustainable, and responsible real estate financing within ever-changing business environments.
Freddie Mac – An organization whose mission is to provide liquidity, stability, and affordability to the U.S. housing market in all economic conditions extending to all communities from coast to coast.
The National Association of Realtors (NAR) – The largest association of real estate professionals in the world.
Fannie Mae – A leading source of financing for mortgage lenders, providing access to affordable mortgage financing in all markets always.

Every source sees home prices continuing to appreciate – just at lower percentages as we move through the next several years.

There are many unsubstantiated theories about what is happening with home prices. From those who are worried that prices are falling (data shows this is untrue), to those who are concerned that prices are again approaching boom peaks because of “irrational exuberance” (this is also untrue as prices are not at peak levels when they are adjusted for inflation), there seems to be no shortage of opinion.
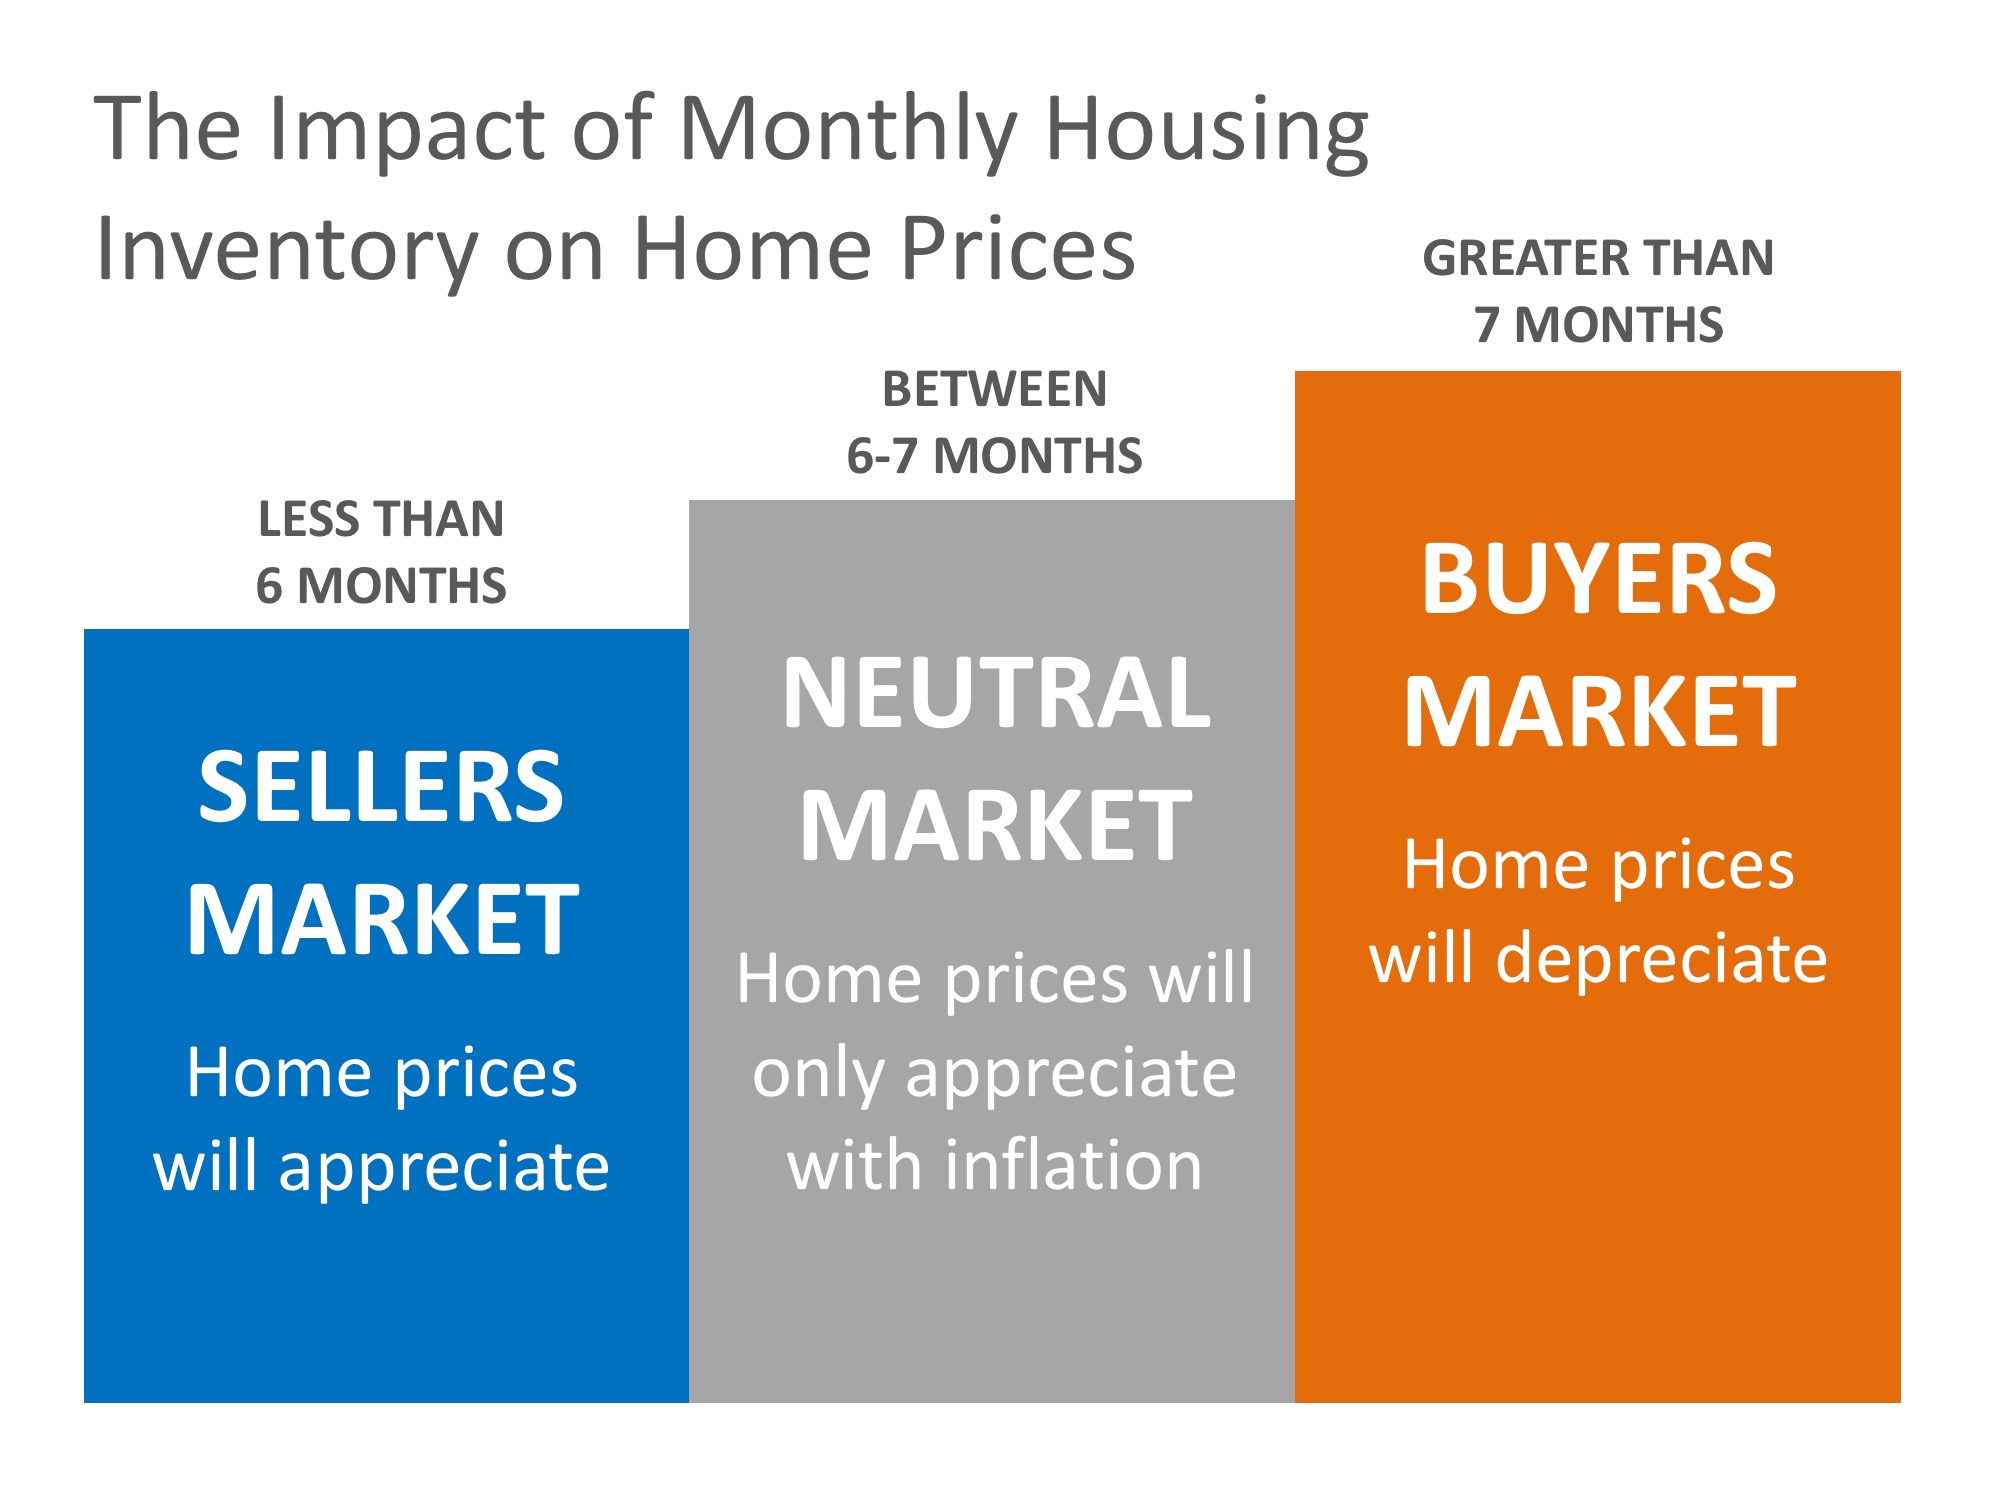
However, the increase in prices is easily explained by the theory of supply & demand. Whenever there is a limited supply of an item that is in high demand, prices increase. It is that simple. In real estate, it takes a six-month supply of existing salable inventory to maintain pricing stability. In most housing markets, anything less than six months will cause home values to appreciate and anything greater than seven months will cause prices to depreciate (see chart below).
According to the Existing Home Sales Report from the National Association of Realtors (NAR), the monthly inventory of homes for sale has been below six months for the last five years (see chart below).
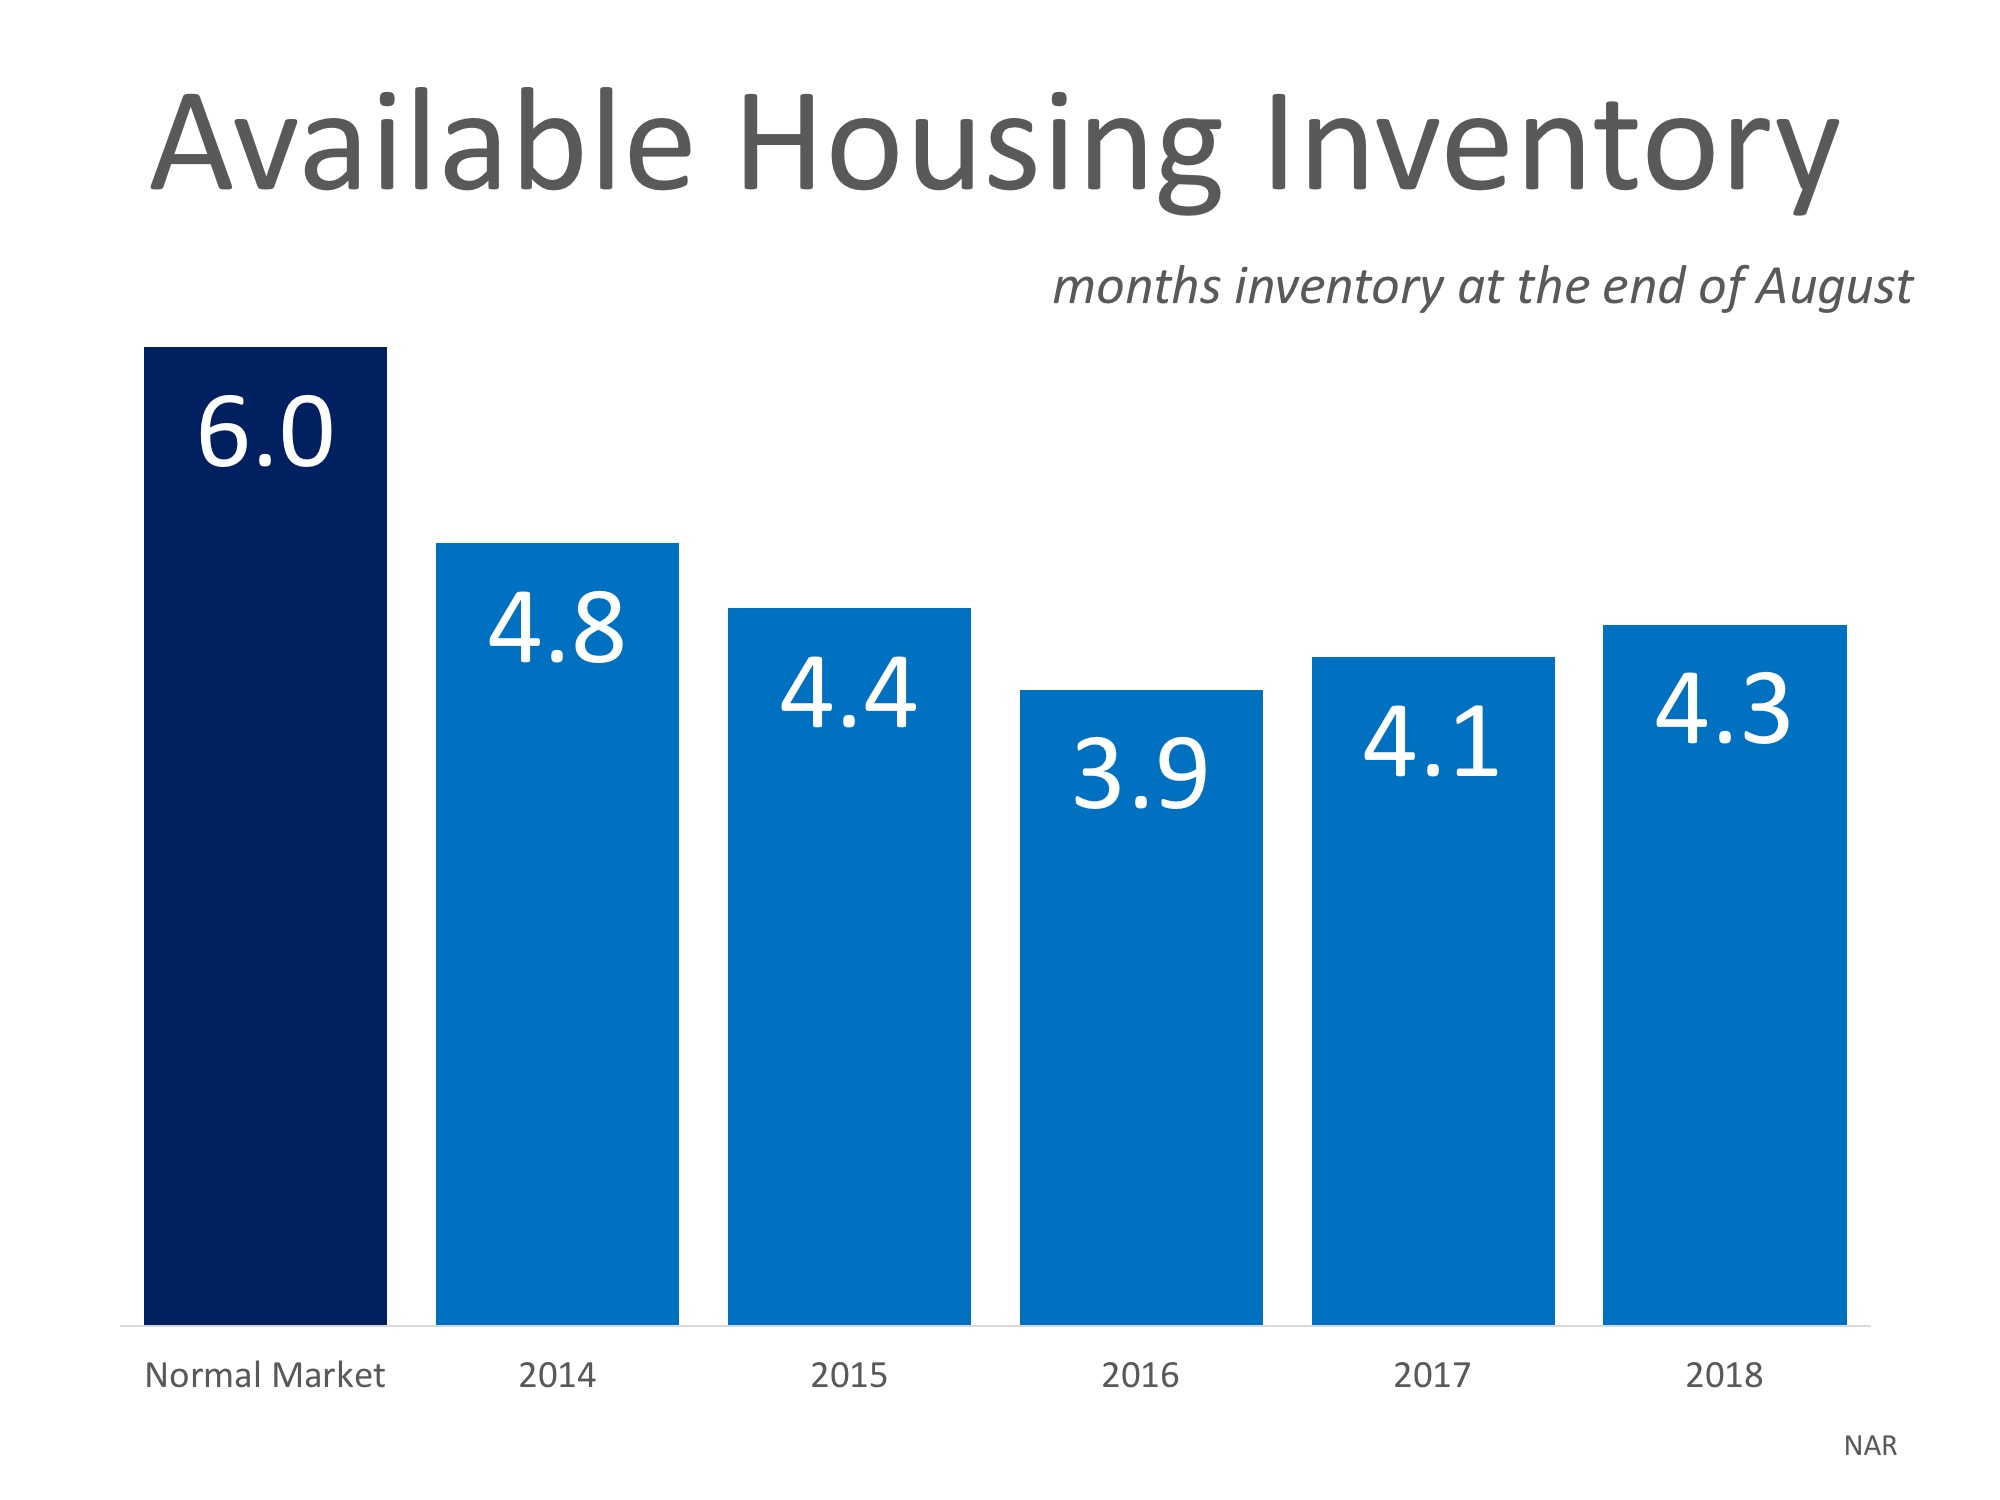
If buyer demand continues to outpace the current supply of existing homes for sale, prices will continue to appreciate. Nothing nefarious is taking place. It is simply the theory of supply & demand working as it should.


For a while now baby boomers have been blamed for a portion of the housing market’s current lack of housing inventory, but should they really be getting the blame?
Aaron Terrazas, Senior Economist at Zillow, says that “Boomers are healthier and working longer than previous generations, which means they aren’t yet ready to sell their homes.”
According to a study by Realtor.com, 85% of baby boomers indicated they were not planning to sell their homes.
It is true that baby boomers are healthier and are thus working and living longer, but are they also refusing to sell their homes?
Last month, Trulia looked at the housing situation of seniors (aged 65+) today compared to that of a decade ago. Trulia’s study revealed that:
“Although seniors appear to be delaying downsizing until later in life, as a group, households 65 and over are still downsizing at roughly the same rate as in years past.”
Trulia also explains that,
“5.5% of households 65 and over moved, pretty evenly split between moves to single family (2.7%) and multifamily (2.4%) homes. In 2005, these percentages were virtually the same, with 5.5% of senior households moving, including 2.5% into single family and 2.5% into multifamily homes.”
Recent reports tell us that the older population grew from 3 million in 1900 to 47.8 million in 2017.
In addition, the Census recently revised the numbers from their National Population Projections:
“The aging of baby boomers means that within just a couple decades, older people are projected to outnumber children for the first time in U.S. history…By 2035, there will be 78.0 million people 65 years and older compared to 76.7 million under the age of 18.”
If you are a baby boomer who is not sure whether you should downsize or move to a warmer climate (other people are doing it, why not you?), let’s get together so we can help you evaluate your options today!

We have all seen the headlines that report that buying a home is less affordable today than it was at any other time in the last ten years, and those headlines are accurate. But, have you ever wondered why the headlines don’t say the last 25 years, the last 20 years, or even the last 11 years?
Obviously, buying a home is more expensive now than during the ten years immediately following one of the worst housing crashes in American history.
Over the past decade, the market was flooded with distressed properties (foreclosures and short sales) that were selling at 10-50% discounts. There were so many distressed properties that the prices of non-distressed properties in the same neighborhoods were lowered and mortgage rates were kept low to help the economy.
Prices have since recovered and mortgage rates have increased as the economy has gained strength. This has and will continue to impact housing affordability moving forward.
However, let’s give affordability some historical context. The National Association of Realtors (NAR) issues their Affordability Index each month. According to NAR:
“The Monthly Housing Affordability Index measures whether or not a typical family earns enough income to qualify for a mortgage loan on a typical home at the national and regional levels based on the most recent monthly price and income data.”
NAR’s current index stands at 138.8. The index had been higher each of the last ten years, peaking at 197 in 2012 (the higher the index the more affordable houses are).
But, the average index between 1990 and 2007 was just 123 and there were no years with an index above 133. That means that homes are more affordable today than at any time during the eighteen years between 1990 and 2007.
With home prices continuing to appreciate and mortgage rates increasing, home affordability will likely continue to slide. However, this does not mean that buying a house is not an attainable goal in most markets as it is less expensive today than during the eighteen-year stretch immediately preceding the housing bubble and crash.

According to the latest New Residential Sales Report from the Census Bureau, new construction sales in August were up 3.5% from July and 12.7% from last year! This marks the second consecutive month with double-digit year-over-year growth (12.8% in July).
The report also showed that builders have ramped up construction with an increase in new construction starts and completions. The summer months are often a busy time for builders as they capitalize on the warmer weather to be able to finish projects.
Below is a table showing the change in starts, completions, and sales from last August.

Other notable news from the report is that the percentage of new construction sales in the $200-$299k range has continued to break away from the $300-$399k range.
This shows that builders are starting to build lower-priced homes that will help alleviate some of the inventory challenges in the starter and trade-up home categories. The chart below shows the full breakdown.

If you are thinking of buying or selling in today’s market, you no doubt have heard that there is a shortage of existing homes for sale which has been driving home prices up across the country. The additional new construction coming to the market could help alleviate this shortage, but we are still not back up to pre-crisis levels.

According to CoreLogic’s latest Home Price Insights Report, national home prices in August were up 5.5% from August 2017. This marks the first time since June 2016 that home prices did not appreciate by at least 6.0% year-over-year.
CoreLogic’s Chief Economist Frank Nothaft gave some insight into this change,
“The rise in mortgage rates this summer to their highest level in seven years has made it more difficult for potential buyers to afford a home. The slackening in demand is reflected in the slowing of national appreciation, as illustrated in the CoreLogic Home Price Index.
National appreciation in August was the slowest in nearly two years, and we expect appreciation to slow further in the coming year.”
One of the major factors that has driven prices to accelerate at a pace of between 6-7% over the past two years was the lack of inventory available for sale in many areas of the country. This made houses a prized commodity which forced many buyers into bidding wars and drove prices even higher.
According to the National Association of Realtors’ (NAR) latest Existing Home Sales Report, we are starting to see more inventory come to market over the last few months. This, paired with patient buyers who are willing to wait to find the right homes, is creating a natural environment for price growth to slow.
Historically, prices appreciated at a rate of 3.7% (from 1987-1999). CoreLogic predicts that prices will continue to rise over the next year at a rate of 4.7%.
As the housing market moves closer to a ‘normal market’ with more inventory for buyers to choose from, home prices will start to appreciate at a more ‘normal’ level, and that’s ok! If you are curious about home prices in your area, let’s get together to chat about what’s going on!