Category Archives: Housing Market Updates

Auto Added by WPeMatico

Is the Current Pace of Home Sales Maintainable?

Is the Current Pace of Home Sales Maintainable? | Simplifying The Market

There are some experts questioning whether the current pace of residential home sales is maintainable. Are too many people buying homes like in 2004-2006? Are we headed for another housing crisis? Actually, if we look closely at the numbers, we can see that we are looking at a very healthy real estate market.

Why the concern?

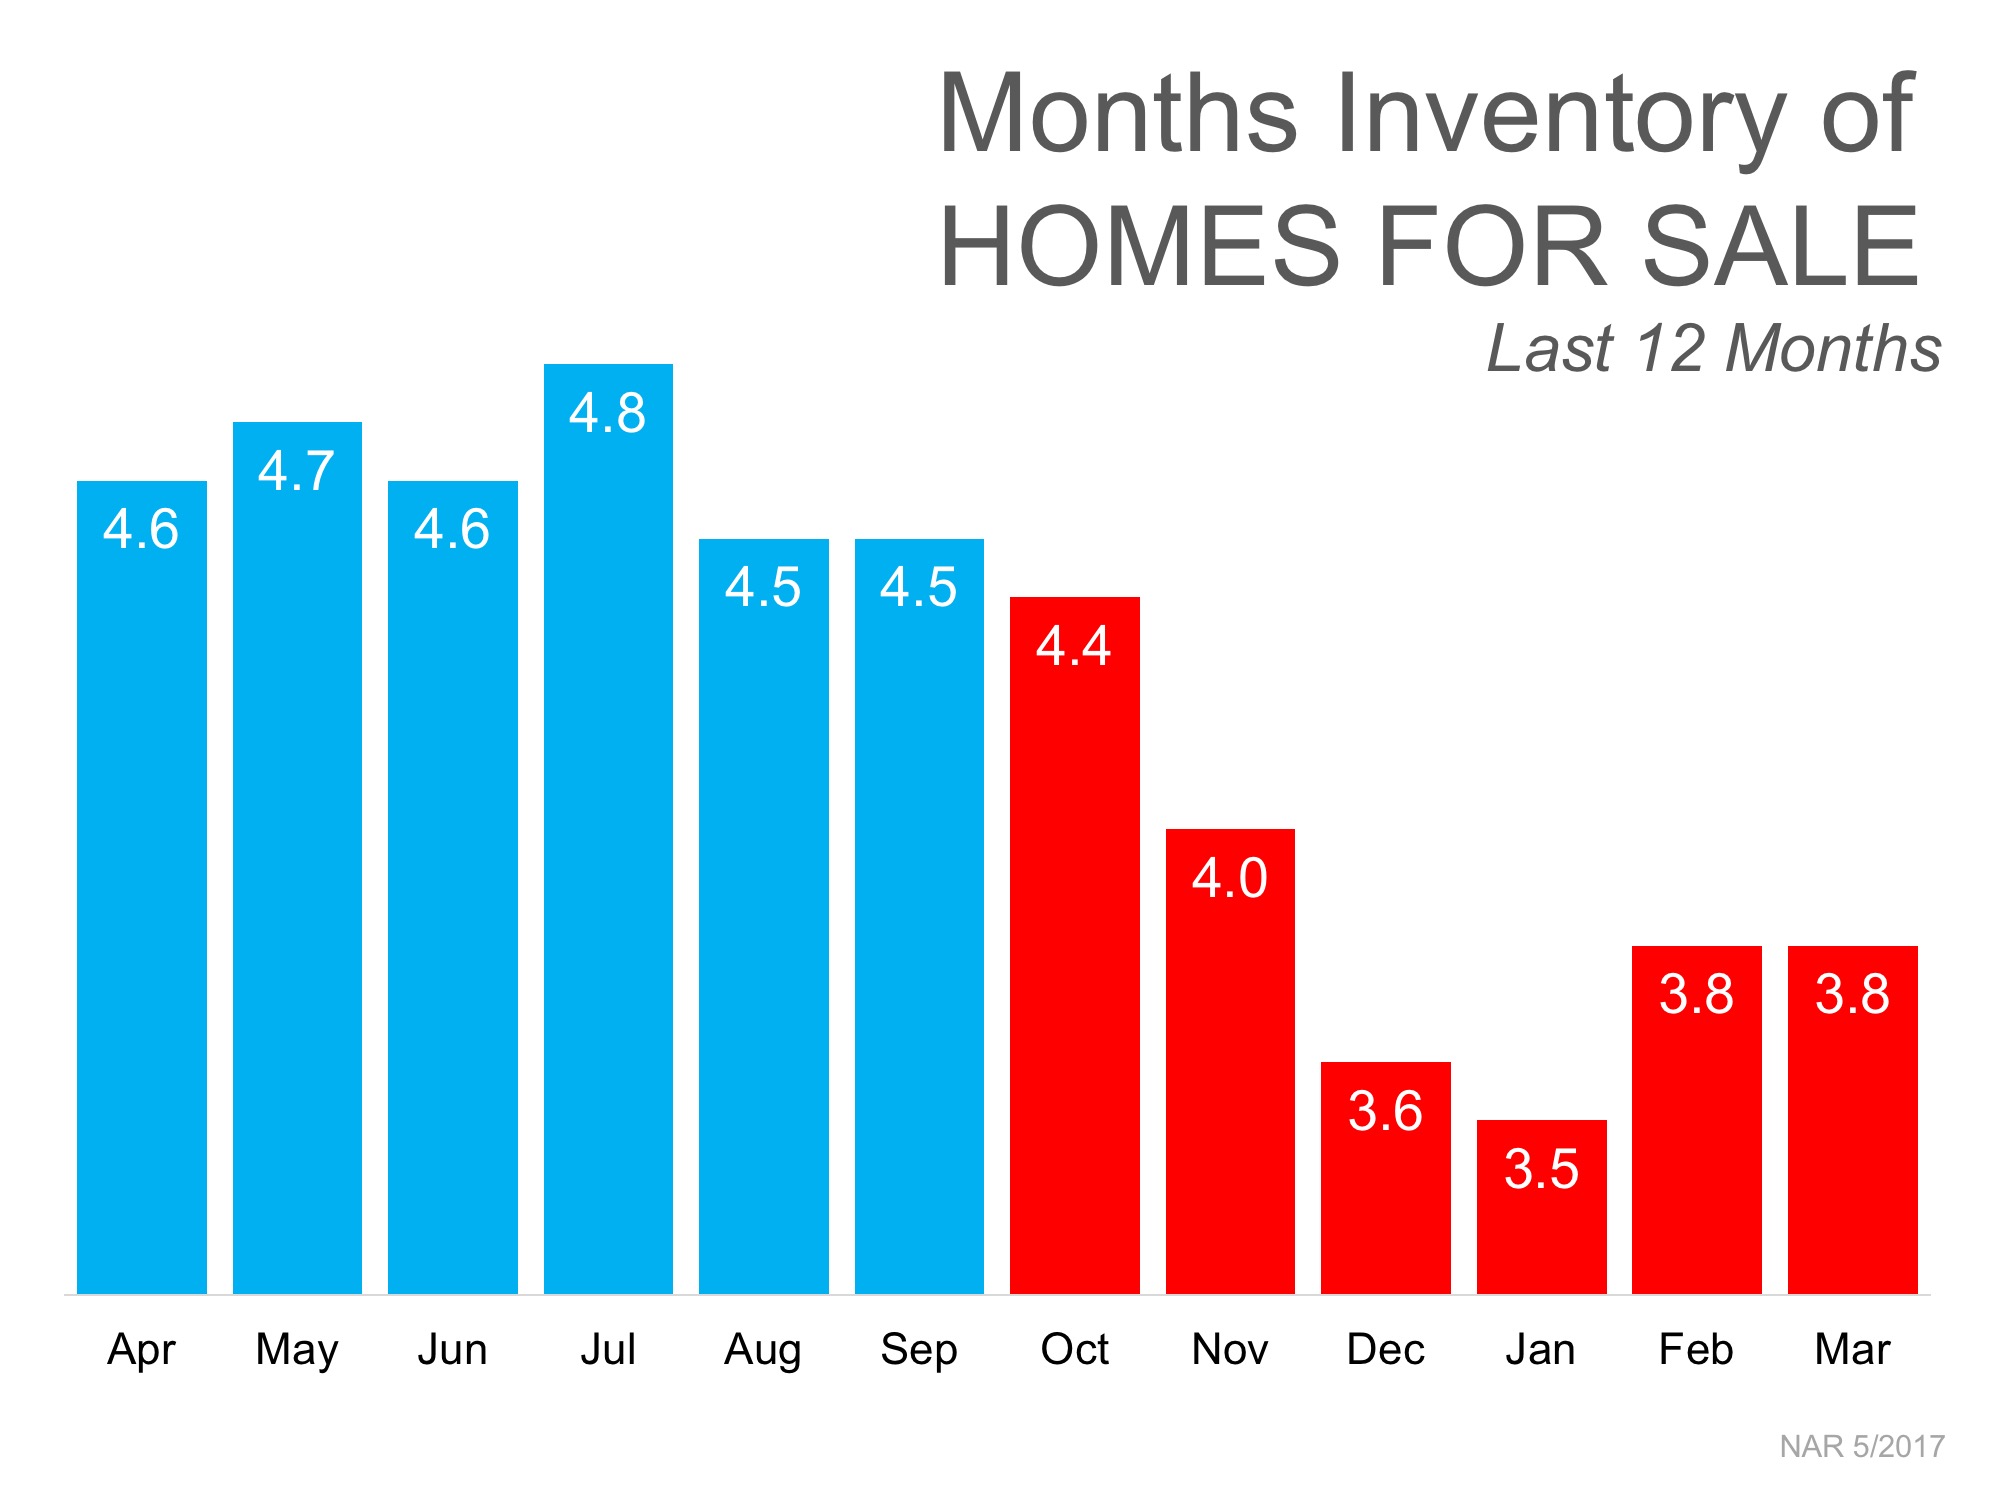
Some are looking at the last four years of home sales and comparing them to the three years just prior to the housing bubble. Looking at the graph below, we can understand that thinking.

Is the Current Pace of Home Sales Maintainable? | Simplifying The Market

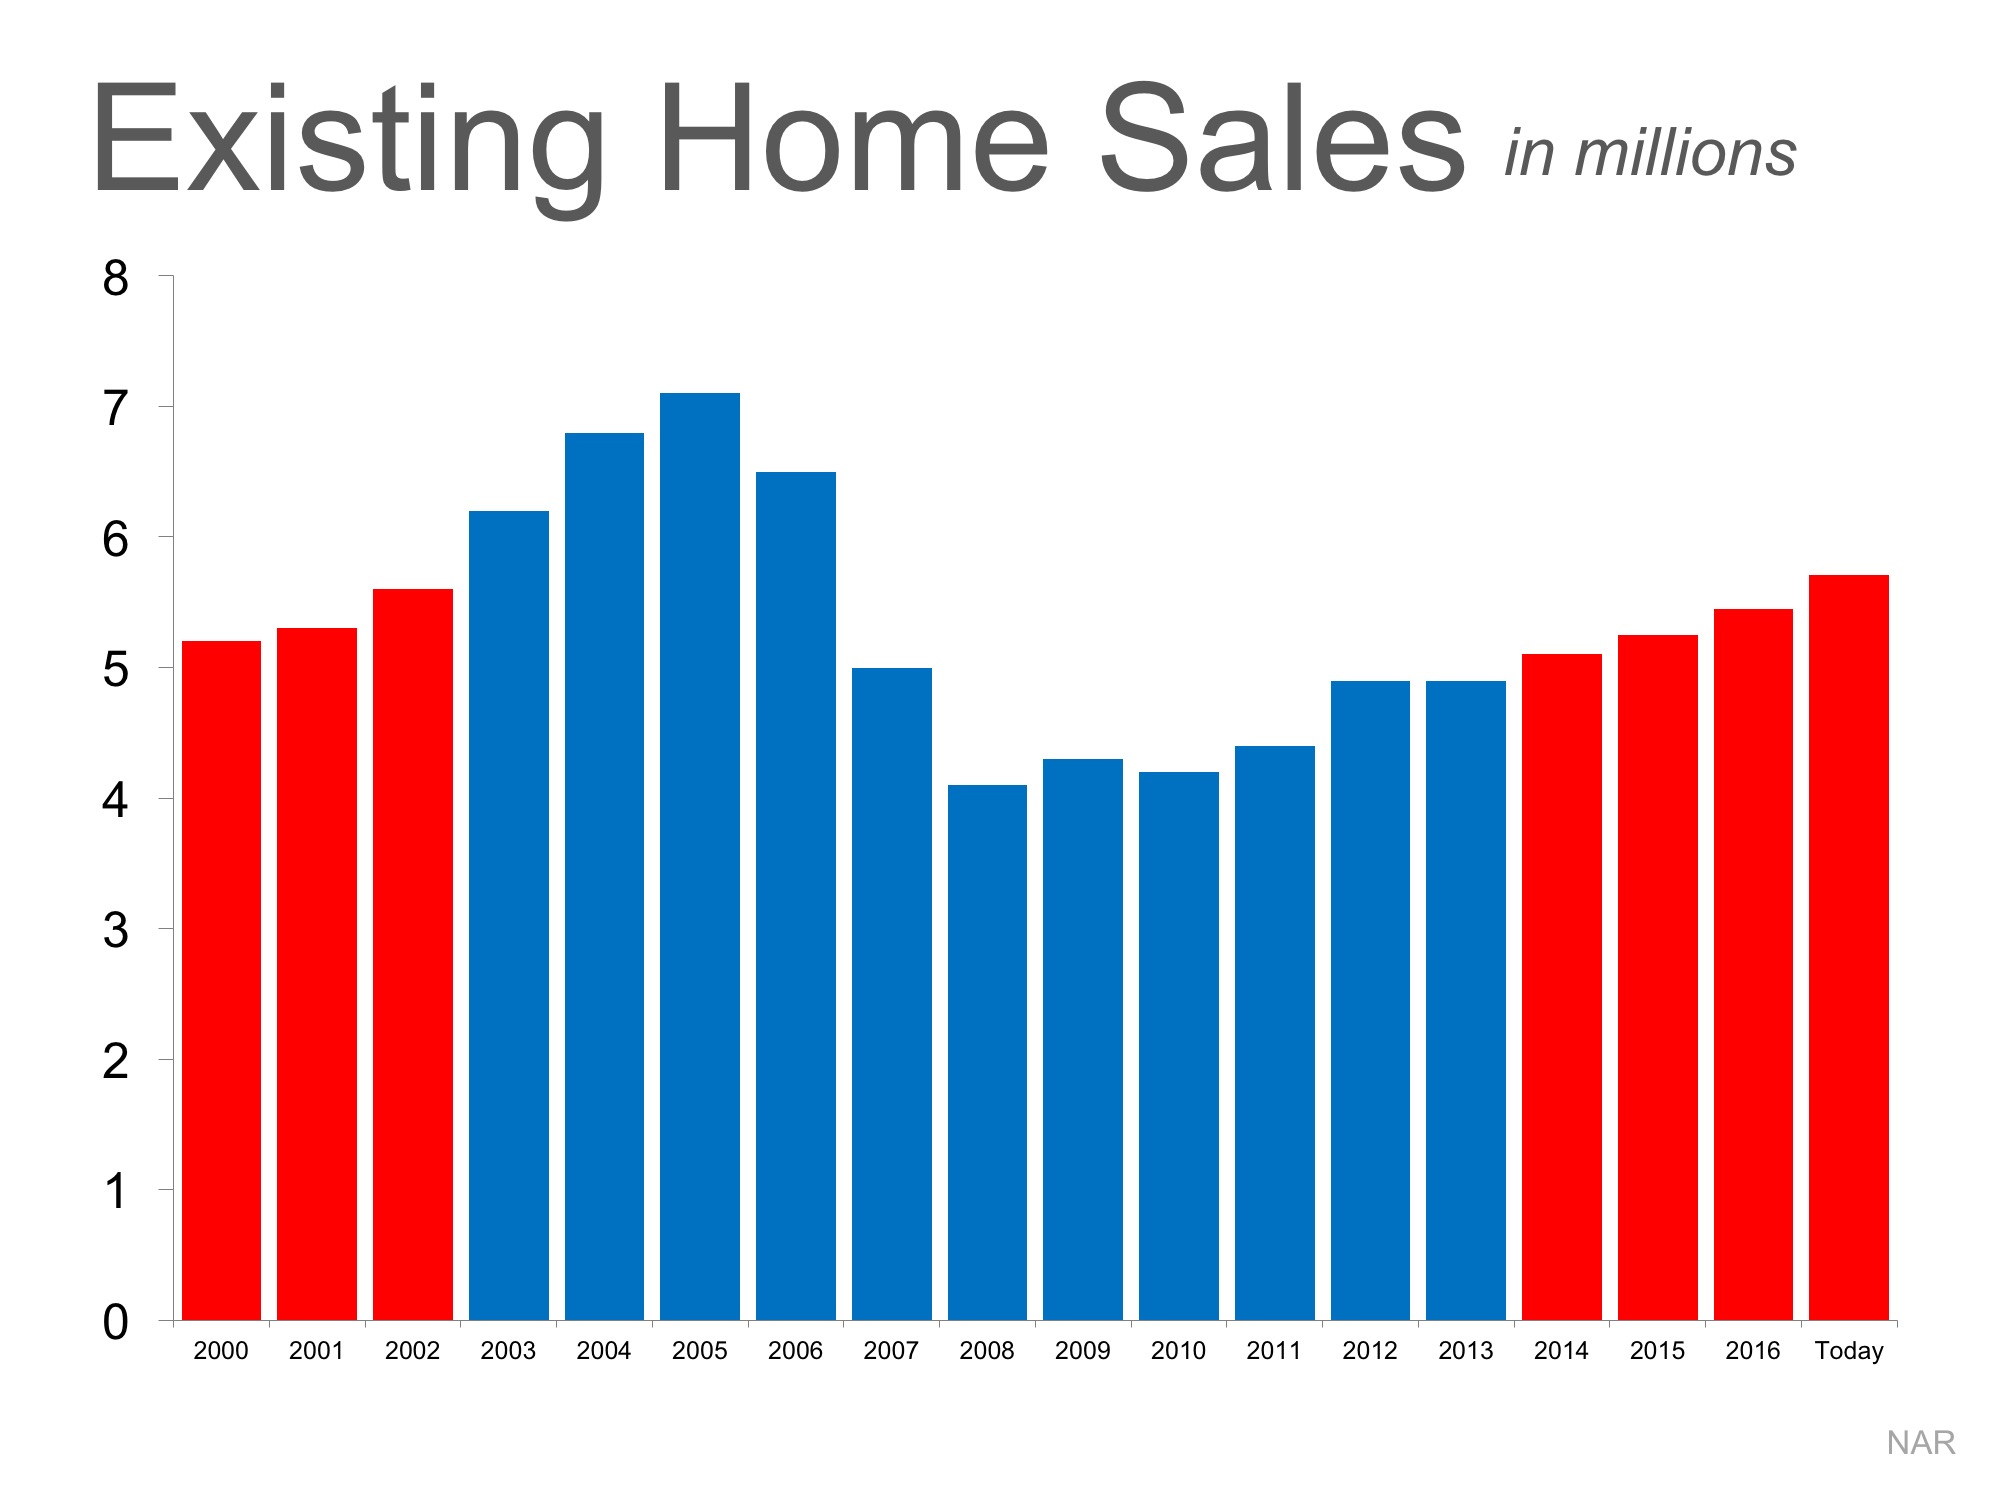
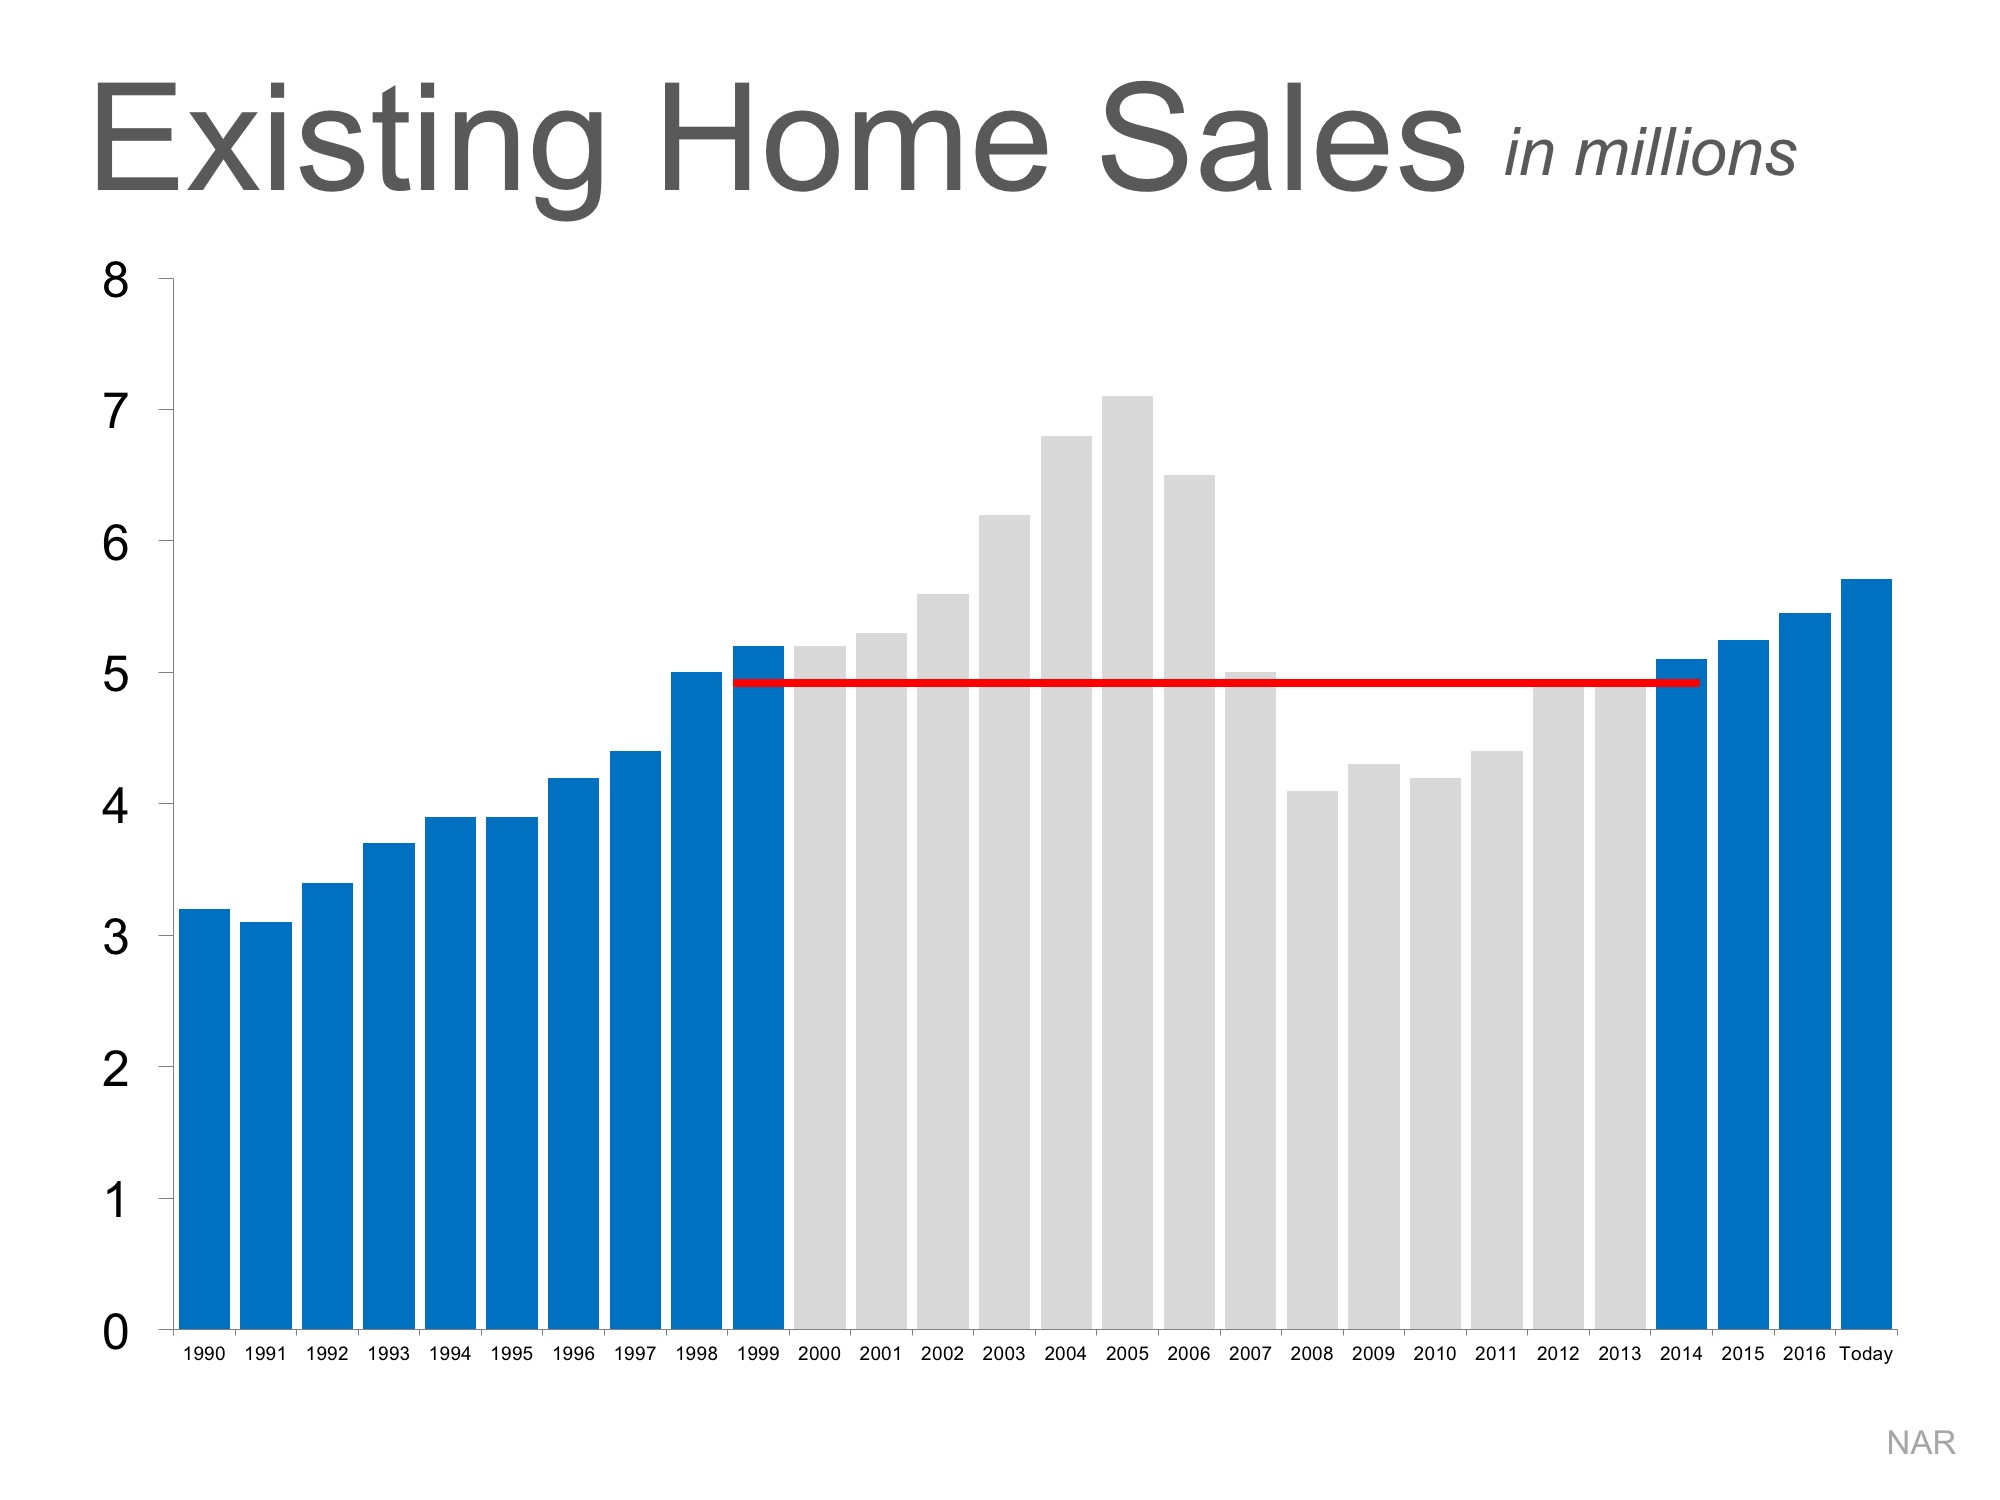
However, if we go further back in history, we can see the real picture. After taking out the “boom & bust” years, the pace of sales is growing at quite a natural pace.

Is the Current Pace of Home Sales Maintainable? | Simplifying The Market

And new home sales are way below historic numbers. Dave Liniger, Re/Max CEO explains:

“We expect a seasonal uptick in sales this time of year and March certainly met and somewhat exceeded that expectation. We don’t anticipate the tightening inventory to ease up in most markets until new home construction can catch up to its pre-recession pace. Until then, sellers will enjoy a fast-paced market and buyers will need to work with their agents to get in the right home.”

Bottom Line

The current pace of residential home sales definitely seems maintainable.

Homes are Selling Fast Across the Country [INFOGRAPHIC]

Homes are Selling Fast Across the Country [INFOGRAPHIC] | Simplifying The Market

Homes are Selling Fast Across the Country [INFOGRAPHIC] | Simplifying The Market

Some Highlights:

  • The National Association of REALTORS® surveyed their members for their monthly Confidence Index.
  • The REALTORS® Confidence Index is a key indicator of housing market strength based on a monthly survey sent to over 50,000 real estate practitioners. Practitioners are asked about their expectations for home sales, prices and market conditions.
  • Homes sold in 60 days or less in 36 out of 50 states, and Washington D.C.
  • Homes typically went under contract in 34 days in March!

3 Charts That Shout, ‘List Your Home Today!’

3 Charts That Shout, ‘List Your Home Today!’ | Simplifying The Market

In school, we all learned the theory of supply and demand. When the demand for an item is greater than the supply of that item, the price will surely rise.

SUPPLY

The National Association of Realtors (NAR) recently reported that the inventory of homes for sale stands at a 3.8-month supply. This is considerably lower than the 6-month supply necessary for a normal market.

DEMAND

Every month NAR reports on the number of buyers out in the market looking for homes, which is also known as buyer traffic. As seen on the map below, buyer demand in March was strong or very strong in 45 out of 50 states nationwide, and Washington, DC.

Many buyers are being confronted with a very competitive market in which they must compete with other buyers for their dream homes (if they are even able to find a home they wish to purchase).

Listing your house for sale now will allow you to capitalize on the shortage of homes for sale in the market, which will translate into a better pricing situation.

HOME EQUITY

Many homeowners underestimate the amount of equity they currently have in their homes. According to a recent Fannie Mae study, 37% of homeowners believe that they have more than 20% equity in their homes. In reality, CoreLogic’s latest Equity Report tells us that 78.9% actually do!

3 Charts That Shout, ‘List Your Home Today!’ | Simplifying The Market

Many homeowners who are undervaluing the equity they have in their homes may feel trapped, which may be contributing to the lack of inventory in the market.

Bottom Line

If you are debating selling your home this year, let’s meet up to evaluate the equity you have in your home, as well as the opportunities available in your market.

Buying this Spring? Be Prepared for Bidding Wars

Buying this Spring? Be Prepared for Bidding Wars | Simplifying The Market

Traditionally, spring is the busiest season for real estate. Buyers come out in force and homeowners list their houses for sale hoping to capitalize on buyer activity. This year will be no different!

Continue reading Buying this Spring? Be Prepared for Bidding Wars

15,014 Homes Sold Yesterday… Did Yours?

15,014 Homes Sold Yesterday… Did Yours? | Simplifying The Market

There are some homeowners that have been waiting for months to get a price they hoped for when they originally listed their house for sale. The only thing they might want to consider is… If it hasn’t sold yet, maybe it’s not priced properly.

After all, 15,014 houses sold yesterday, 15,014 will sell today and 15,014 will sell tomorrow.

15,014!

That is the average number of homes that sell each and every day in this country, according to the National Association of Realtors’ (NAR)  latest Existing Home Sales Report. NAR reported that sales are at an annual rate of 5.48 million. Divide that number by 365 (days in a year) and we can see that, on average, over 15,014 homes sell every day.

The report from NAR also revealed that there is currently only a 3.8-month supply of inventory available for sale, (6-months inventory is considered ‘historically normal’).

This means that there are not enough homes available for sale to satisfy the buyers who are out in the market now in record numbers.

Bottom Line

We realize that you want to get the fair market value for your home. However, if it hasn’t sold in today’s active real estate market, perhaps you should reconsider your current asking price.

Consumer Confidence in Economy & Housing is Soaring

Consumer Confidence in Economy & Housing is Soaring | Simplifying The Market

The success of the housing market is strongly tied to the consumer’s confidence in the overall economy. For that reason, we believe 2017 will be a great year for real estate. Here is just a touch of the news coverage on the subject. Continue reading Consumer Confidence in Economy & Housing is Soaring

How Low Supply & High Demand Impacts the Real Estate Market [INFOGRAPHIC]

How Low Supply & High Demand Impacts the Real Estate Market [INFOGRAPHIC] | Simplifying The Market

Some Highlights:

  • The concept of Supply & Demand is a simple one. The best time to sell something is when the supply of that item is low & the demand for that item is high!
  • Anything under a 6-month supply is a Seller’s Market!
  • There has not been a 6-months inventory supply since August 2012!
  • Buyer Demand continues to outpace Seller Supply!

The Foreclosure Crisis: 10 Years Later

The Foreclosure Crisis: 10 Years Later | Simplifying The Market

CoreLogic recently released a report entitled, United States Residential Foreclosure Crisis: 10 Years Later, in which they examined the years leading up to the crisis all the way through to present day.

Continue reading The Foreclosure Crisis: 10 Years Later

What Are the Experts Saying about Mortgage Rates?

What Are the Experts Saying about Mortgage Rates? | Simplifying The Market

Mortgage interest rates have risen over the last few months and projections are that they will continue their upswing throughout 2017. What impact will this have on the housing market? Here is what the experts are saying:

Laurie Goodman, Co-director of the Urban Institute’s Housing Finance Policy Center:

“In 1984, 1994, 2000, and 2013, every time we have rate increases, we have increases in nominal home prices. We expect this to be more pronounced, as there is a big demand-and-supply gap at the present time.”

Scott Anderson, Chief Economist for Bank of the West:

“The tightening labor market, rising wage growth, high levels of consumer confidence and a millennial generation with a pent-up demand for housing should allow the housing market to weather the storm of gradually rising interest rates.”

Ivy Zelman in her latest “Z” Report:

“Although we strongly believe that the housing supply-demand imbalance for single-family homes will continue to drive above-average home price appreciation, just as falling mortgage rates aided pricing power on the margin in recent months, we expect the opposite effect to become evident in the coming months. As such, we project year-end home price inflation of 4.8% for 2017 and 4.1% for 2018.”

Bob Walters, President & COO of retail mortgage lender Quicken Loans:

“A modest increase in mortgage rates won’t have much of an effect on home purchases. A buyer may need to slightly re-evaluate which homes they can afford, but it’s not likely to make an impact on qualifying, in most cases.”

First American Chief Economist Mark Fleming:

“Our survey data shows that mortgage rates would have to be significantly higher to have any meaningful impact. The house buying power that borrowers have, even with rates below five percent, still remains historically strong.”

Which Homes Have Appreciated the Most?

Which Homes Have Appreciated the Most? | Simplifying The Market

Home values have risen dramatically over the last twelve months. The latest Existing Home Sales Report from the National Association of Realtors puts the annual increase in the median existing-home price at 7.1%. CoreLogic, in their most recent Home Price Insights Report, reveals that national home prices have increased by 6.9% year-over-year. Continue reading Which Homes Have Appreciated the Most?